Figures & data
Figure 1 Flow chart for patients’ selection.
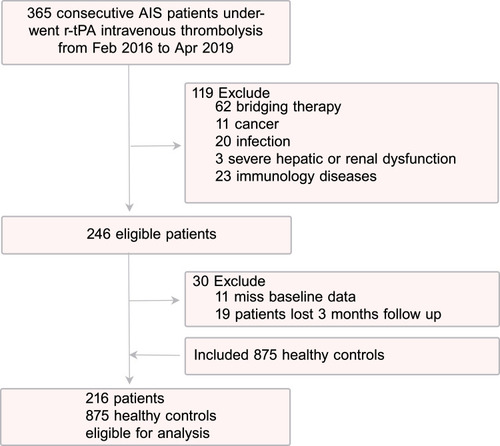
Table 1 Baseline Clinical Characteristics of AIS Patients and Healthy Controls
Table 2 Comparisons of Baseline Characteristics and Outcomes Between SII Groups
Figure 2 Receiver operator characteristic curves for the prediction of 3-month poor outcome using systemic immune-inflammation index (SII).
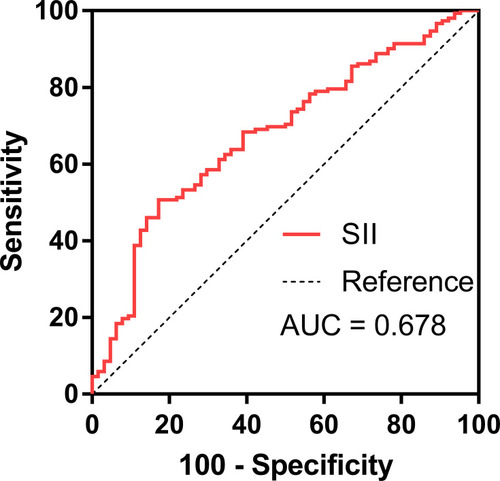
Figure 3 The association between SII and NIHSS. (A) A positive correlation of SII with NIHSS scores (rs = 0.305, p < 0.001). The red solid straight line was produced by linear regression while the black dotted line represented curve fitting by third order polynomial (cubic). (B) Patients with NIHSS > 10 (n = 60) had a significant increase in SII compared to those with NIHSS ≤ 10 (n = 156) (p = 0.001).
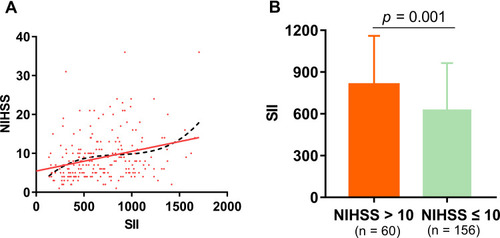
Table 3 Univariate and Multivariate Logistic Regression Analysis for 3-month Poor Outcome
Table 4 Reclassification and Discrimination Statistics for Poor Functional Outcomes by SII at 3 Months
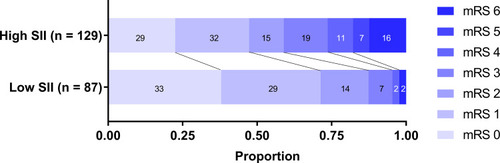
Figure 4 mRS distribution at 3 months for high SII group vs low SII group. mRS, modified Rankin Scale; SII, systemic immune-inflammation index.