Figures & data
Figure 1 Flow chart of the trial.
Abbreviations: FiO2, fraction of inspired oxygen; SpO2, oxygen saturation; h, hour.
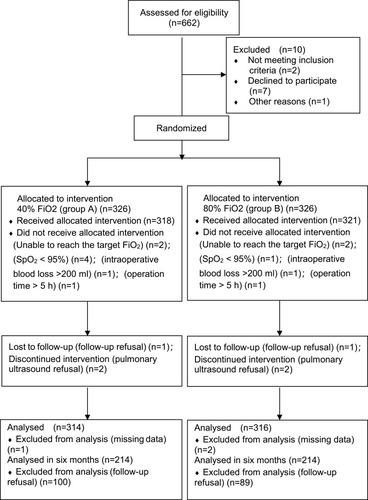
Table 1 Characteristics of Participants
Table 2 Postoperative Characteristics of Participants
Figure 2 (A) Comparison of intraoperative PaO2 at T1-4 time points in the two groups included. (B) Comparison of intraoperative rSO2 at T1-4 time points in the two groups included. (C) Comparison of intraoperative SpO2 at T1-4 time points in the two groups included.
Abbreviations: PaO2, oxygen partial pressure; rSO2, regional cerebral oxygen saturation; SpO2, oxygen saturation.
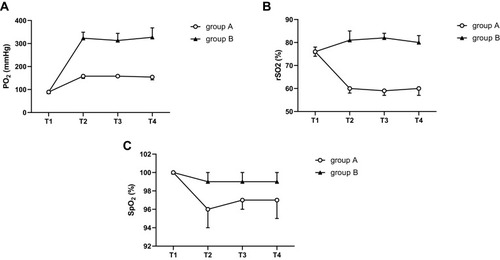
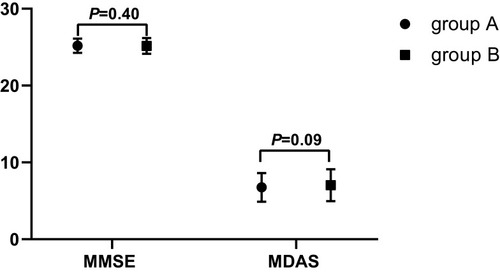
Figure 3 Preoperative MMSE and postoperative MDAS score for the study period are presented over time. Values are reported for 40% FiO2 (circles) and 80% FiO2 (squares) randomization groups individually.
Abbreviations: MMSE, Mini Mental State Scale; MDAS, Memorial Delirium Assessment Scale.