Figures & data
Figure 1 Concentration of plasma MDS-OAβ according to groups.
Abbreviations: AD, Alzheimer’s disease; MCI, mild cognitive impairment; MDS-OAβ, Multimer Detection System-Oligomeric Amyloid-β; OND, other neurodegenerative disease; SCD, subjective cognitive decline.
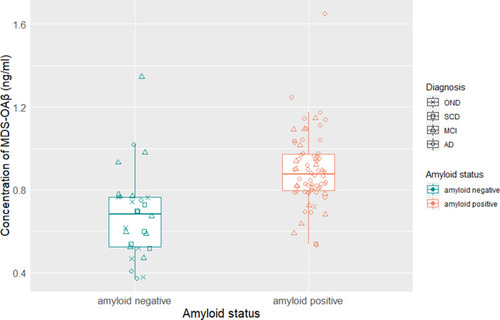
Table 1 Demographics and Clinical Characteristics of Subjects
Table 2 Performance of Predictors for Amyloid PET Positivity with and without MDS-OAβ Positivity
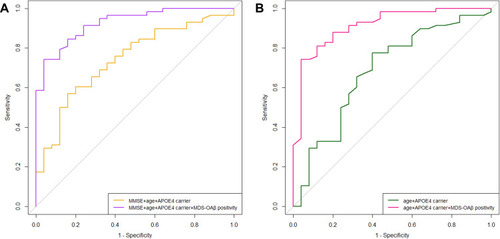
Figure 2 Receiver operating characteristic analysis of MDS-OAβ positivity with other predictors on amyloid PET positivity. (A) Added MDS-OAβ positivity to clinical information such as age, MMSE score, and APOE ε4 status, predictability for amyloid PET positivity improves. (B) Considered only objective factors such as age and APOE ε4 status, combining with MDS-OAβ positivity strengthened the predictability on amyloid PET positivity.
Abbreviations: MDS-OAβ, Multimer Detection System-Oligomeric Amyloid-β; MMSE, Mini-Mental-State-Examination.