Figures & data
Figure 1 The workflow of this study.
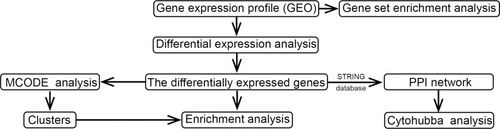
Figure 2 The differentially expressed genes (DEGs) for carotid atherosclerosis and control samples. (A) A volcano plot of the for carotid atherosclerosis and control samples. Red indicated upregulated genes and blue indicated downregulated genes. The gray area showed the gene expression below the threshold criteria. (B) The heatmap of the DEGs.
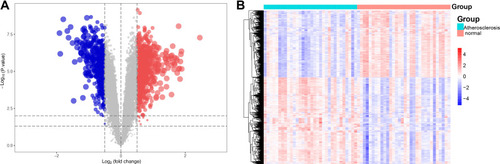
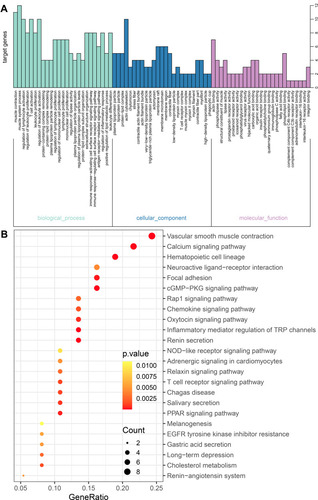
Figure 3 The biological functions of differentially expressed genes (DEGs). (A) Cellular component, (B) biological process, (C) molecular function and (D) KEGG pathway analysis. The gene set enrichment analysis (GSEA) for (E) GO and (F) KEGG for carotid atherosclerosis and control samples.
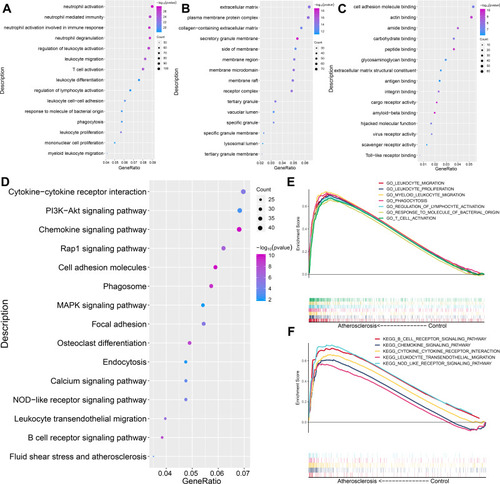
Figure 4 The PPI network. A graphic representation of the protein–protein network based on differentially expressed genes of carotid atherosclerosis and control samples. Red nodes indicated upregulated genes and light blue nodes indicated downregulated genes in the carotid atherosclerosis group.
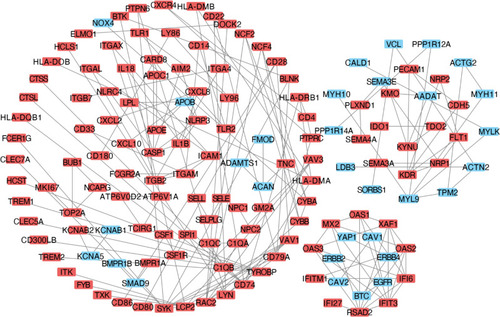
Figure 5 The selection and analysis of hub genes. Top 50 genes selected based the four ranking methods. (A) Degree, (B) DMNC, (C) MCC and (D) MNC. The darker the color of the node, the higher the score. DMNC, density of maximum neighborhood component; MCC, maximal clique centrality. MNC, maximum neighborhood component. (E) Venn plot. Venn plot of the overlapping genes for the top 50 genes selected based on the four ranking methods. Degree, DMNC, MNC, and MCC. (F) The expression levels for 16 hub genes in carotid atherosclerosis samples compared with control samples.
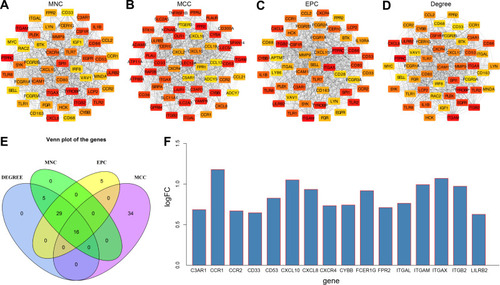
Figure 6 The GO and KEGG enrichment analysis for the genes in cluster 1 obtained based the MCODE method. (A) The biological processes and (B) KEGG pathways for genes in cluster 1.
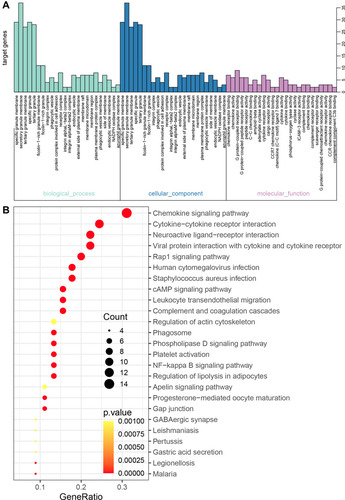
Figure 7 The GO and KEGG enrichment analysis for the genes in cluster 2 obtained based the MCODE method. (A) The biological processes and (B) KEGG pathways for genes in cluster 2.
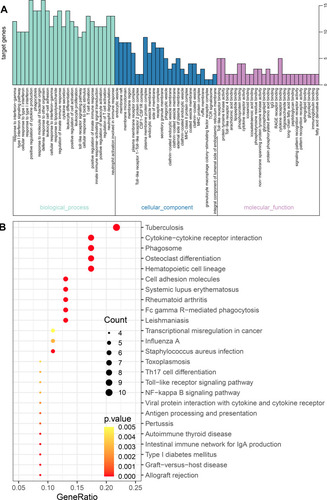
Figure 8 The GO and KEGG enrichment analysis for the genes in cluster 3 obtained based the MCODE method. (A) The biological processes and (B) KEGG pathways for genes in cluster 3.
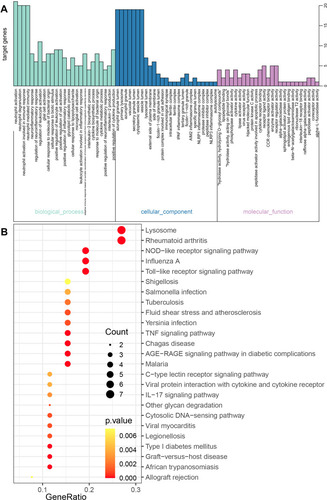
Figure 9 The GO and KEGG enrichment analysis for the genes in cluster 4 obtained based the MCODE method. (A) The biological processes and (B) KEGG pathways for genes in cluster 4.
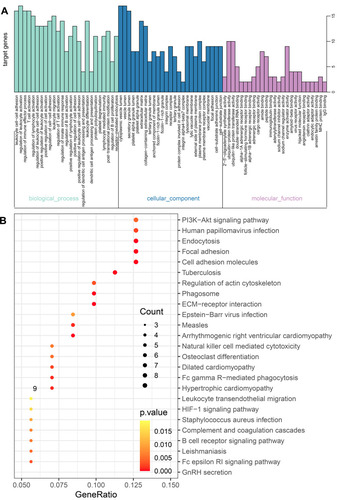
Figure 10 The GO and KEGG enrichment analysis for the genes in cluster 5 obtained based the MCODE method. (A) The biological processes and (B) KEGG pathways for genes in cluster 5.