
Figures & data
Table 1 Clinical Characteristics of the Study Cohort and Control Group at Hospital Admission
Table 2 Clinical and Biochemical Characteristics of the Study Cohort According to Clinical Outcome
Table 3 Matrix of Univariate Correlations Between Variables of Interest in Elderly Discharged (A) and Deceased (B) Patients
Figure 1 Glomerular function of the study cohort of elderly patients in relation to clinical outcome. Data are shown as mean±SE.
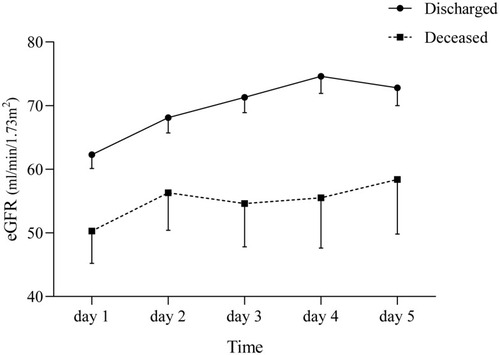
Table 4 Univariate and Multivariate Analysis in the Whole Cohort of Elderly Patients (n=80)