Figures & data
Table 1 The Cockcroft-Gault Formula for Estimating Creatinine Clearance (CrCl)Citation11,Citation12
Table 2 Results of the Study
Figure 1 The relationship between the absolute value of D (difference eGFR -eClCr) - Y axis and BMI - X axis. The red line represents the local regression.
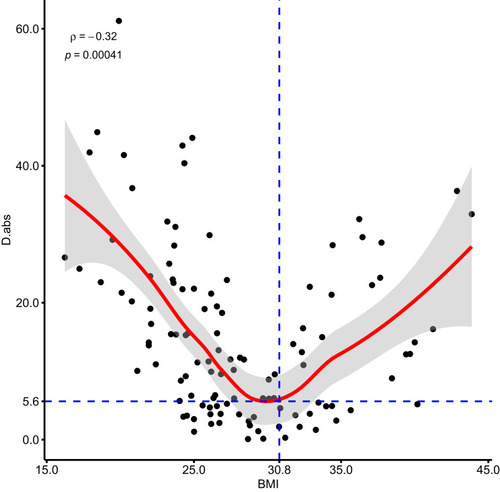
Figure 2 The relationship between the absolute value of D (difference eGFR -eClCr) - Y axis, and body surface area - X axis. The red line represents the local regression.
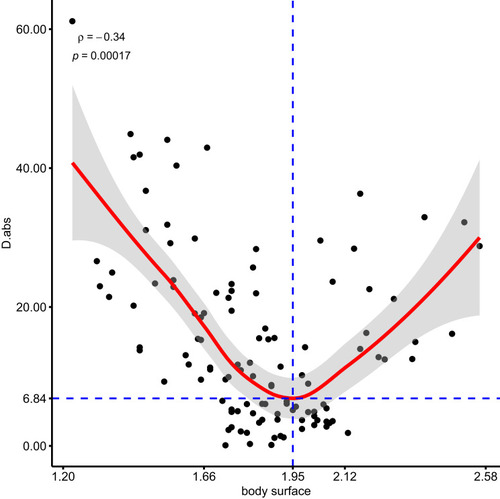
Figure 3 The relationship between the value D (difference eGFR - eClCr) - Y axis, and BMI - X axis. The red line represents the local regression.
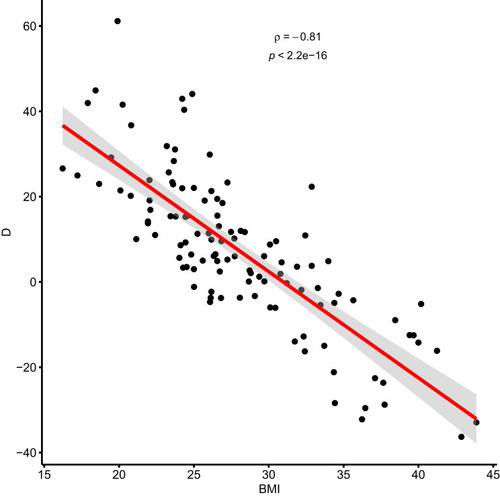
Figure 4 The relationship between the value D (difference eGFR - eClCr) - Y axis, and body surface area - X axis. The red line represents the local regression.
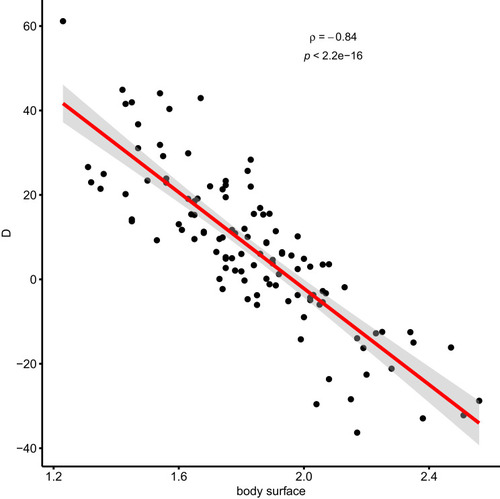
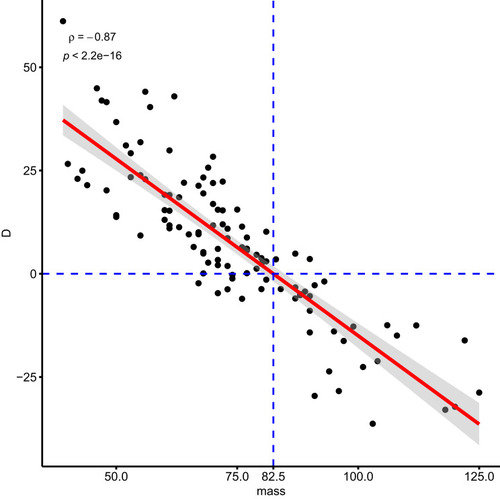
Figure 5 The relationship between the value D (difference eGFR - eClCr) - Y axis, and body mass - X axis. The red line represents the local regression.