
Figures & data
Figure 1 Example of measurement of Hounsfield unit (HU) values by computed tomography. An oval region of interest is placed over the (A) upper, (B) middle, and (C) lower axial planes of the vertebral body, and the HU value is automatically calculated by picture archiving and communication system.
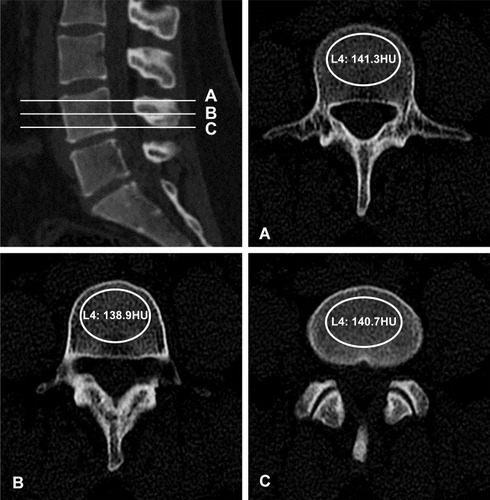
Figure 2 Example of the endplate scoring system: (A) grade 1: normal endplate without breaks or defects; (B) grade 2: focal thinning without endplate breaks or defects; (C) grade 3: focal disc marrow contacts with the normal endplate contour maintained; (D) grade 4: defect or damage to up to 25% of the total endplate area; (E) grade 5: defect or damage to up to 50% of the total endplate area; (F) grade 6: complete damage of the endplate area.
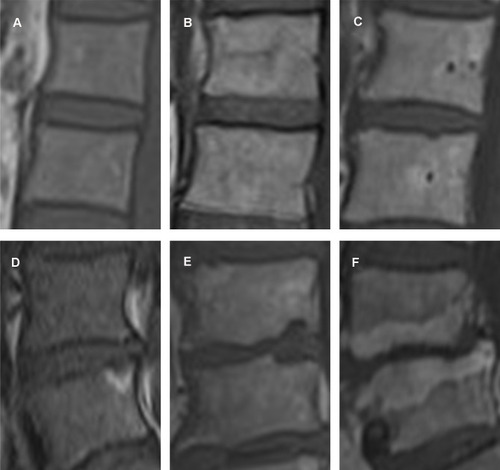
Table 1 General Information
Table 2 Comparison of Patient Data Between the Low- and Normal-BMD Groups
Figure 3 Comparison of the total endplate scores between the normal- and low-BMD groups in every segment in L1/2–L4/5.
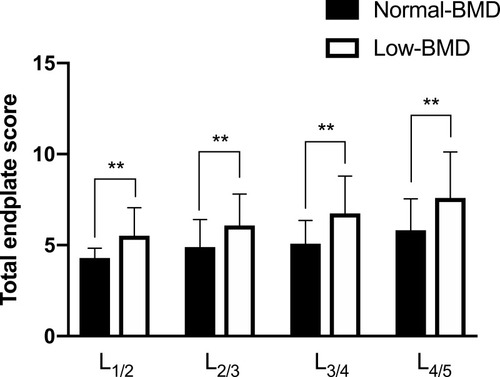
Figure 4 Linear correlation (black line) between the Hounsfield unit (HU) values and total endplate scores (TEPS), and the correlation coefficient (R2). Significant correlation coefficients are marked with an asterisk.
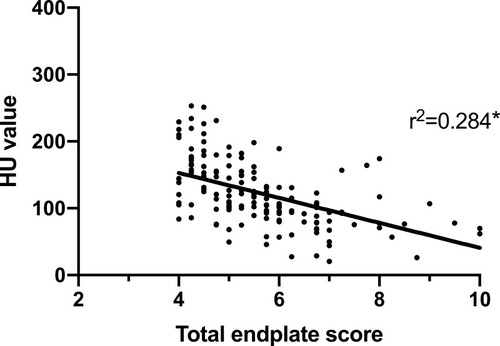
Table 3 Univariate and Multivariate Associations of the Total Endplate Scores with the HU Value and Other Variables Considered