Figures & data
Figure 1 Number of cases admitted into intensive care for both groups from 2007–2011.
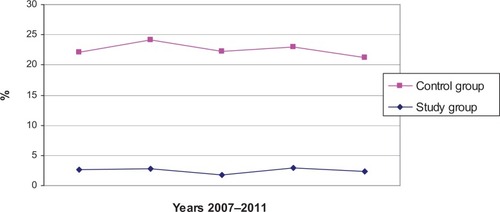
Figure 2 Intensive care settings: the number of treatments on the medical intensive care unit and interdisciplinary intensive care unit of the department of anesthesiology.
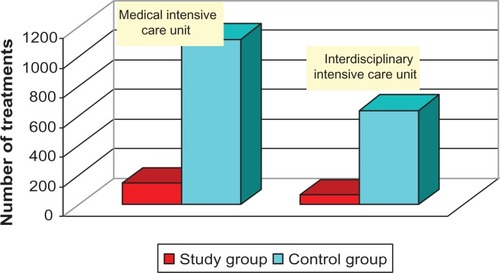
Figure 3 The number of treatments on the general wards of the internal departments in the study group and the control group, from 2007–2011.
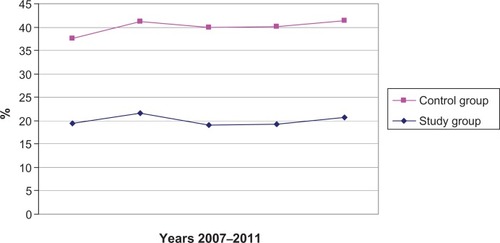
Figure 4 Gender distribution in the intensive care units.
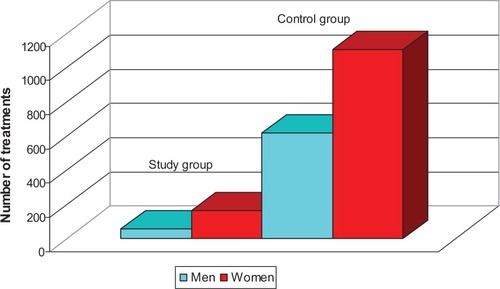
Table 1 Number of medical cases admitted into intensive care by type
Table 2 Number of acute illnesses admitted into intensive care by type
Table 3 Number of cardiovascular risk factors in both groups by type
Table 4 Comorbidities in both groups