
Figures & data
Figure 1 Flowchart describing the process of inclusion into the study and the intervention period. Number (N) of participants at each time point and reasons for exclusion; failed MRI processing (eg due to excessive movement), death and percentages (%) of withdrawal at baseline and after 1, 3 and 5 years of intervention for the MRI study are provided.
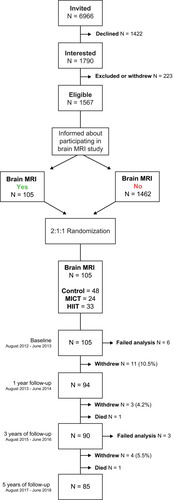
Table 1 Demographics and Clinical Data for the Control, MICT and HIIT Participants Undergoing Brain MRI at Baseline
Table 2 Linear Mixed Model Analyses of Brain Volumes During 5 Years of Intervention (Model 1) in HIIT and MICT Group Compared to Control Group
Figure 2 Mean and 95% CI for total hippocampal, cortex, thalamus, caudate and white matter volumes (mL) adjusted for ICV at each time point in the control (grey circle), moderate intensity continuous training (MICT) (orange triangle) or high intensity interval training (HIIT) (blue square) groups. See and Supplementary Table 7 for results of statistical comparisons.
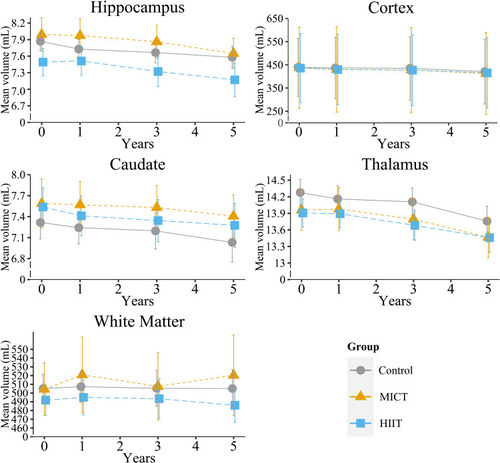
Figure 3 Mean and 95% CI for CRF, objectively measured as VO2peak, at each time point in the control (grey circle), moderate intensity continuous training (MICT) (orange triangle) and high intensity interval training (HIIT) (blue square) groups. See Supplementary Table 13 for results of statistical comparisons.
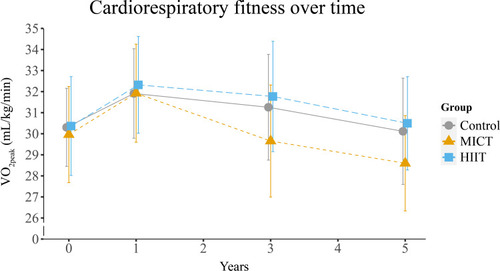
Table 3 Linear Regressions Predicting Brain Volumes Across All Participants After 1, 3 and 5 Years of Intervention Based on Baseline CRF