
Figures & data
Figure 1 Disability distribution of the elderly at various time points before death.
Notes: Participant number (N) in each year before death was contributed by all the participants with disability records before death. For example, the interview wave was in 1996, 1999, 2003, 2007, and 2011. Therefore, those who died in 1997, 2000, 2004, 2008, and 2012, contributed to data for disability status one year before death. Similarly, for those who died in 2016, their disability score on 1996–2011 TLSA data contributed to disability records before the death of 5, 9, 13, 17, and 20 years ago.
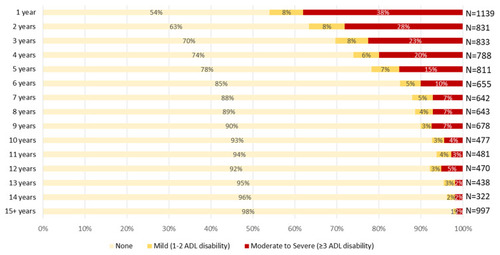
Table 1 Descriptive Statistics for the Elderly with Moderate to Severe Levels of Disability
Table 2 Regression Coefficients of Factors Predicting Years Before Death for Older Adults Who Were Moderately to Severely Disabled
Table 3 Factors Predicting Years Before Death for Older Adults Who Were Moderately to Severely Disabled (by Gender)