Figures & data
Figure 1 Study flow chart.
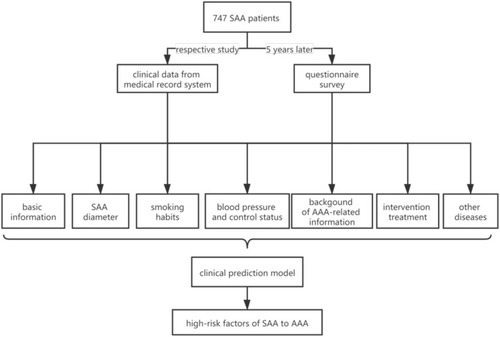
Table 1 Basic Demographics of Patients
Table 2 The Correlation Between Continuous Variables and the Progression of SAA to AAA
Figure 2 The correlation between variables and the progress of SAA to AAA. Multivariate analysis of the high-risk factors of SAA progressing to AAA. (A) Verification diagram of SAA-related risk factors; (B) screening diagram of SAA-related risk factors.
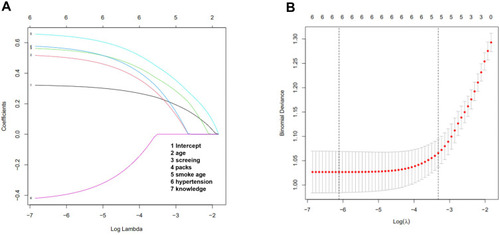
Table 3 The Probability of Developing AAA with the Total Score of Risk Factors
Figure 3 Clinical prediction model prediction score. The C-index was performed to verify the predictive ability.
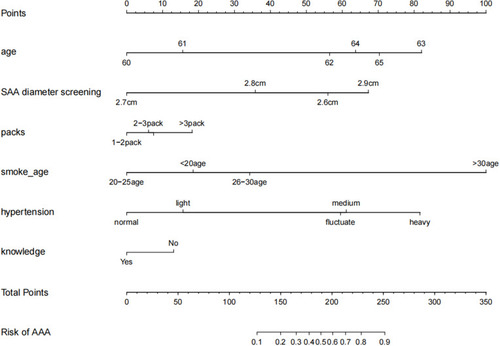
Table 4 The Predictive Ability of the Verification Model
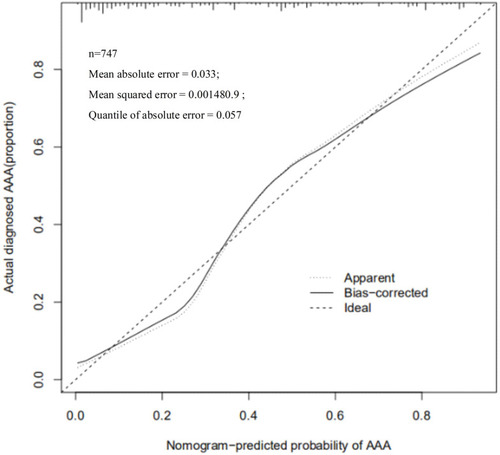
Figure 4 Verification of the predictive ability of the model. The Nomogram-predicted probability of AAA were determined by Calibration chart.