Figures & data
Figure 1 Patient flowchart of this study.
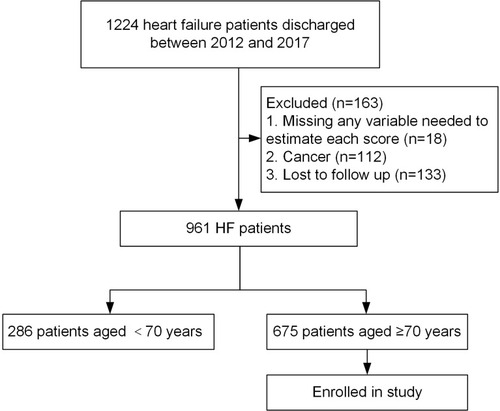
Table 1 Baseline Characteristics of Elderly Patients with Heart Failure by Status at 1-Year Follow-Up
Figure 2 Kaplan–Meier curves of all-cause mortality stratified by tertiles of the SHFM (A) and MAGGIC (B) scores. The two risk scores were significantly associated with mortality (log-rank P<0.0001 for all survival curves).
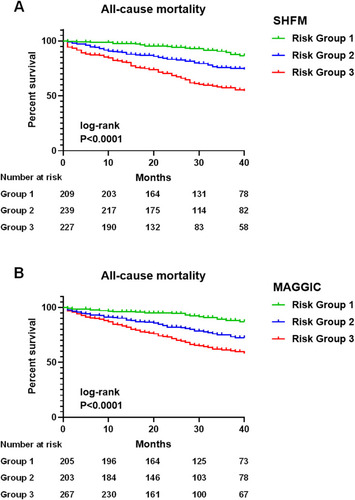
Figure 3 Receiver operating characteristic curves comparing the areas under the curve of risk scores for 1-year mortality.
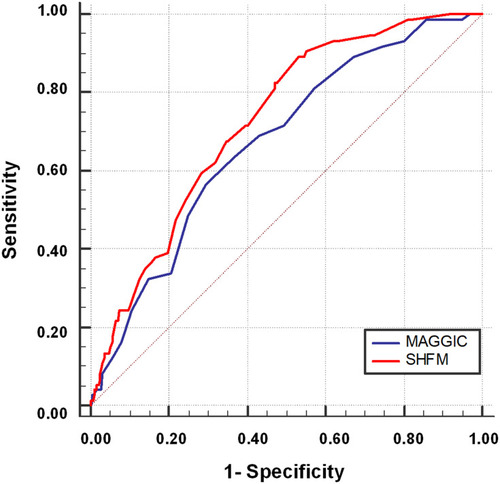
Table 2 Comparison of C-Statistic of the SHFM versus the MAGGIC Score for 1-Year Mortality in Different Age Groups
Figure 4 1-year observed probabilities of mortality at different risk deciles in the overall population predicted by (A) the Seattle Heart Failure Model (SHFM) and (B) the Meta-Analysis Global Group in Chronic Heart Failure (MAGGIC) score. The diagonal dashed lines represent perfect calibration.
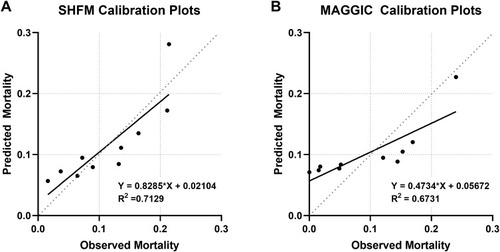
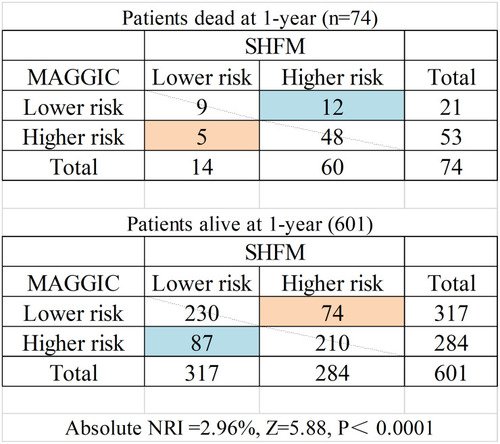
Figure 5 Risk reclassification of the MAGGIC versus SHFM score for 1-year mortality in elderly heart failure patients.