Figures & data
Figure 1 Micro-computed tomography (μ-CT) scan, 3-D reconstruction, region of interest (ROI) and volume of interest (VOI) selection, and bone microarchitecture analysis in 3-D trabecular bone.
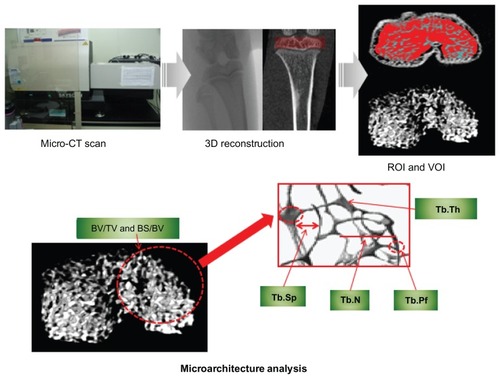
Figure 2 (A–F) Relative variables of trabecular bone microarchitecture in the tibial epiphysis at weeks 0, 4, and 8 (black bar, control group; white bar, osteoarthritis group).
Abbreviations: BV/TV, bone volume/tissue volume; BS/BV, bone surface/bone volume; Tb.Pf, trabecular bone pattern factor; Tb.N, trabecular bone number; Tb.Th, trabecular bone thickness; Tb.Sp, trabecular bone separation.
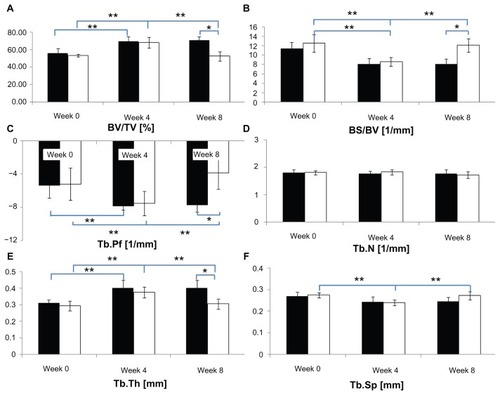
Table 1 Incidence of microarchitectural alterations in each microarchitectural parameter in terms of the individual analysis for control and osteoarthritis groups
Figure 3 Alteration of trabecular bone thickness distribution in the tibial epiphysis at weeks 0, 4, and 8 (vertical axis, trabecular bone thickness, mm; horizontal axis, bone percentage; black bar, control group; white bar, osteoarthritis group).
Abbreviations: BV/TV, bone volume/tissue volume; BS/BV, bone surface/bone volume; Tb.Pf, trabecular bone pattern factor; Tb.N, trabecular bone number; Tb.Th, trabecular bone thickness; Tb.Sp, trabecular bone separation.
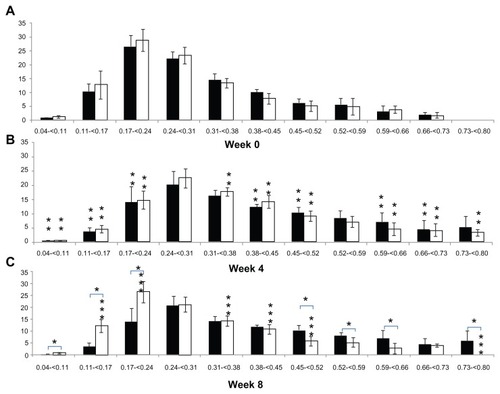
Figure 4 (A–C) Alteration in trabecular bone separation distribution in the tibial epiphysis at weeks 0, 4, and 8 (vertical axis, trabecular bone separation, mm; horizontal axis, bone percentage; black bar, control group; white bar, osteoarthritis group).
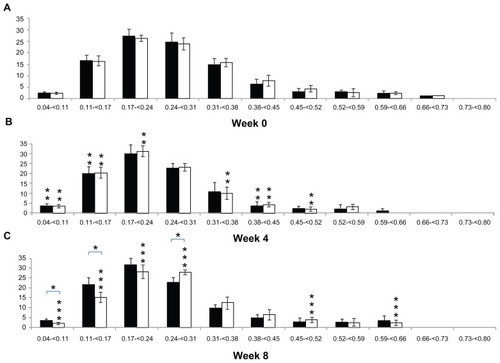
Table 2 Changes in bone mineral density (vBMD) of control and osteoarthritis groups at 0, 4, and 8 weeks
Figure 5 Representative radiological results in osteoarthritic (OA group) and normal (CON group) knee joints at 0, 4, and 8 weeks (white arrowhead, bone erosion and osteophyte formation).
Abbreviations: OA, osteoarthritis; CON, control group.
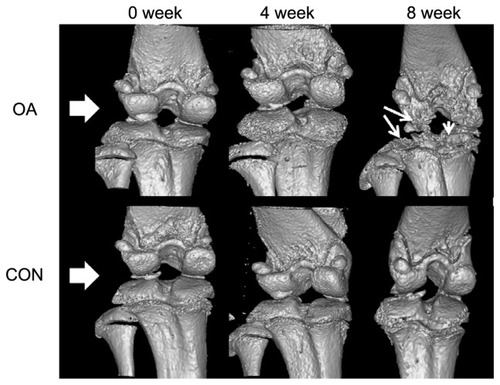
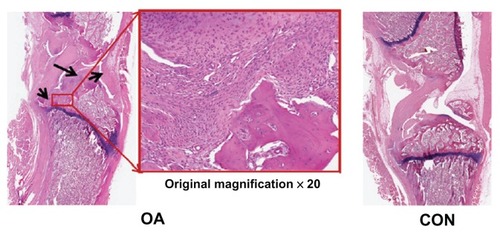
Figure 6 Representative histological sections of osteoarthritis (OA group) and normal (CON group) knee joints (black arrowheads in the ×20 magnification of the OA section show bone erosion, inflammation, pannus formation, and synovial hypertrophy).