
Figures & data
Figure 1 Flowchart of the population selection of the MCABAs.
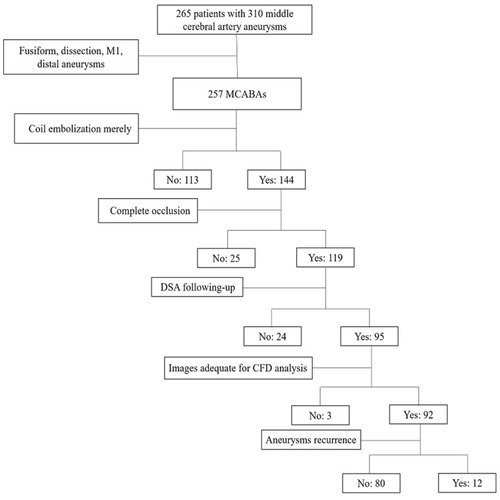
Table 1 Clinical Features of 92 MCABAs in the Recurrent and Non-Recurrent Groups
Table 2 Morphological and Hemodynamic Parameters of 92 MCABAs in the Recurrent and Non-Recurrent Groups Preoperatively
Figure 2 Representative images of a recurrent middle cerebral artery bifurcation aneurysm (MCABA). (A–C) The DSA images were acquired from a 43-years-old woman with a left MCABA. (A) Preoperative DSA revealing a left MCABA. (B) Immediate postoperative DSA revealing the degree of aneurysm embolization reaching the standard of Raymond I (complete occlusion). (C) The follow-up DSA after 6 months revealed that the aneurysm was recurrent. (A1, A2) The hemodynamic analysis preoperatively of the recurrent MCABA. (A1) MWSS was the peak systolic WSS (T = 0.2s). (A2) Flow velocity (T = 0.2s), The blood flow from M1 directly impacted the MCABA sac with relatively high WSS, where two vortexes began to form. Compared with the aneurysmal sac, higher WSS was found at the neck of the MCABA (black arrow shown). (B1, B2) The hemodynamic analysis of immediate post-operative recurrent MCABA. (B1) MWSS. (B2) Flow velocity. The filling material blocked the blood flow from M1 to the aneurysm sac, promoting the streamline to the M2. Compared with the aneurysmal sac, higher WSS was also found at the neck of the recurrent MCABA (black arrow shown, T = 0.2s). MWSS and flow velocity on the aneurysmal neck on the pre-operation are significantly higher than those immediately post-operatively for recurrent MCABA (black arrow showed, T = 0.2s). (C1, C2) The hemodynamic analysis on follow-up of the recurrent MCABA. (C1) MWSS. (C2) Flow velocity. The blood streamlined from M1 flow into a new aneurysm sac formed at the neck of previous aneurysms, where a new complex vortex began to form (T = 0.2s).
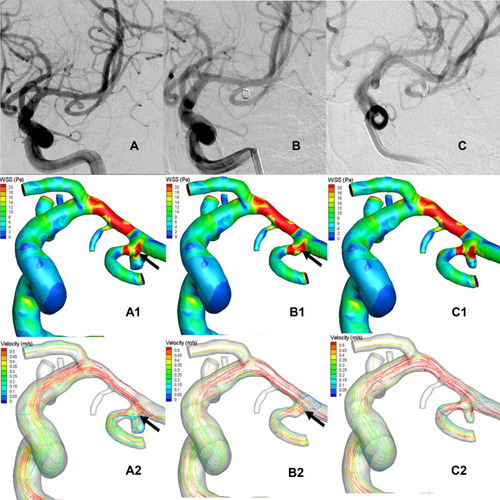
Figure 3 Representative images of a non-recurrent middle cerebral artery bifurcation aneurysm (MCABA). (A–C) The DSA images were acquired from a 56-year-old woman with a left MCABA. (A) Preoperative DSA revealing a left MCABA. (B) Immediately after the operation, DSA showed the degree of aneurysm embolization reached the standard of Raymond I. (C) The follow-up DSA after 4 months showed that the aneurysm was non-recurrent. (A1, A2) The hemodynamic analysis preoperatively of the left MCABA. (B1, B2) The hemodynamic analysis immediately postoperatively of the non-recurrent MCABA. (C1, C2) The hemodynamic analysis at follow-up of the non-recurrent MCABA. (A1, B1, C1) MWSS (T = 0.2 s). (A2, B2, C2) Flow velocity (T = 0.2 s). The blood-flow pattern of the non-recurrent MCABA preoperatively was the same as the recurrent MCABA; however, the MWSS and flow velocity at the aneurysmal neck immediately postoperatively were remarkably lower than those preoperatively (Black arrow showed, T = 0.2 s).
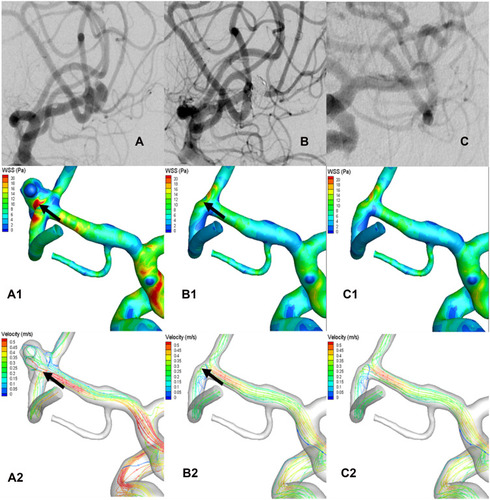
Table 3 Hemodynamic Parameters of 92 MCABAs Between the Recurrent and Non-Recurrent Groups Preoperatively and Immediately Postoperatively