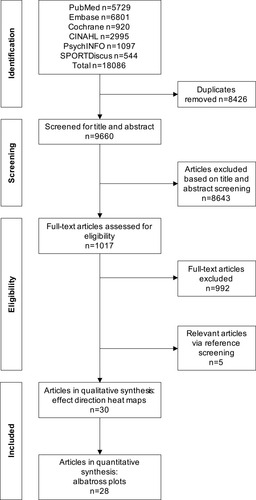
653
Views
12
CrossRef citations to date
0
Altmetric
Review

The Association of Objectively Measured Physical Activity and Sedentary Behavior with (Instrumental) Activities of Daily Living in Community-Dwelling Older Adults: A Systematic Review

ORCID Icon, ORCID Icon, ORCID Icon, ORCID Icon & ORCID Icon
Pages 1877-1915 | Published online: 28 Oct 2021

Figures & data

Figure 1 Flowchart of article selection process.

Figure 1 Flowchart of article selection process.

Table 1 Characteristics of Included Studies

Table 2 Scoring of Study Quality Based on Modified Versions of the Newcastle–Ottawa Scale for Cross-Sectional and Longitudinal Studies

Table 3 Measurement Methods and Scores of Physical Activity and Sedentary Behavior

Table 4 Assessment, Scores, and Breakdown of Activities in Tool Used for the Assessment of Activities of Daily Living

Table 5 Assessment, Scores, and Breakdown of Activities in Tool Used for the Assessment of Instrumental Activities of Daily Living

Figure 2 Effect direction heat map visualizing associations of objectively measured physical activity and sedentary behavior with (A) activities of daily living and (B) instrumental activities of daily living based on p-values, ordered by sample size, and stratified by study design (cross-sectional and longitudinal). ± indicate positive/negative effect direction (higher PA and lower SB are associated with better (+) or worse (-) activities of daily living (ADL) or instrumental activities of daily living (IADL). PA/SB measures: Counts=activity counts, EE=energy expenditure, TPA=total physical activity, MVPA=moderate to vigorous physical activity, LPA=light physical activity, SB=sedentary behavior, break rate=number of breaks per sedentary hour, BST=breaks in sedentary time. ▲/▼ (dark blue): p<0.001, ▲/▼ (blue): 0.001≤p<0.01, ▲/▼ (light blue): 0.01≤p<0.05, Δ/ (light grey): 0.05≤p<0.1, Δ/ (grey): 0.1≤p<0.25, Δ/ (dark grey): p≥0.25. *activities of daily living or instrumental activities of daily living as independent variables and PA/SB as dependent variable. dDisease population.

Abbreviations: M, Males; F, Females.
Figure 2 Effect direction heat map visualizing associations of objectively measured physical activity and sedentary behavior with (A) activities of daily living and (B) instrumental activities of daily living based on p-values, ordered by sample size, and stratified by study design (cross-sectional and longitudinal). ± indicate positive/negative effect direction (higher PA and lower SB are associated with better (+) or worse (-) activities of daily living (ADL) or instrumental activities of daily living (IADL). PA/SB measures: Counts=activity counts, EE=energy expenditure, TPA=total physical activity, MVPA=moderate to vigorous physical activity, LPA=light physical activity, SB=sedentary behavior, break rate=number of breaks per sedentary hour, BST=breaks in sedentary time. ▲/▼ (dark blue): p<0.001, ▲/▼ (blue): 0.001≤p<0.01, ▲/▼ (light blue): 0.01≤p<0.05, Δ/▽ (light grey): 0.05≤p<0.1, Δ/▽ (grey): 0.1≤p<0.25, Δ/▽ (dark grey): p≥0.25. *activities of daily living or instrumental activities of daily living as independent variables and PA/SB as dependent variable. dDisease population.

Figure 3 Albatross plots depicting the magnitude of associations, provided as standardized regression coefficients (βs), of higher physical activity (PA) and lower sedentary behavior (SB) with (A) activities of daily living and (B) instrumental activities of daily living. ● (green) steps, ● (pink) activity counts, ● (yellow) energy expenditure, ■ (red) total physical activity, ■ (blue) moderate to vigorous physical activity, ■ (light green) light physical activity, ▲ (purple) inverse sedentary behavior, ▲ (orange) break rate (number of breaks per sedentary hour), ▲ (cyan) breaks in sedentary time. β = ±0.10, β = ±0.20, β = ±0.30.

Figure 3 Albatross plots depicting the magnitude of associations, provided as standardized regression coefficients (βs), of higher physical activity (PA) and lower sedentary behavior (SB) with (A) activities of daily living and (B) instrumental activities of daily living. ● (green) steps, ● (pink) activity counts, ● (yellow) energy expenditure, ■ (red) total physical activity, ■ (blue) moderate to vigorous physical activity, ■ (light green) light physical activity, ▲ (purple) inverse sedentary behavior, ▲ (orange) break rate (number of breaks per sedentary hour), ▲ (cyan) breaks in sedentary time. β = ±0.10, β = ±0.20, β = ±0.30.

Figure 4 Continued.

Figure 4 Continued.

Figure 4 Albatross plots depicting the magnitude of associations, provided as standardized regression coefficients (βs), of higher physical activity (PA) and lower sedentary behavior (SB) with activities of daily living (ADL) and instrumental activities of daily living (IADL), stratified by (A) population (general versus disease), (B) study design (cross-sectional versus longitudinal), (C) adjustment (adjusted versus unadjusted associations), (D) device location (accelerometer versus pedometer), and (E) device wearing location. (A) population selection: ● general, ○ disease, (B) study design: ● cross-sectional, ○ longitudinal, (C) adjustment: ● adjusted, ○ unadjusted, (D) device type ● accelerometer, ○ pedometer, (E) device wearing location: ● (green) wrist, ● (pink) triceps, ● (yellow) hip. β = ±0.10, β = ±0.20, β = ±0.30.

Figure 4 Albatross plots depicting the magnitude of associations, provided as standardized regression coefficients (βs), of higher physical activity (PA) and lower sedentary behavior (SB) with activities of daily living (ADL) and instrumental activities of daily living (IADL), stratified by (A) population (general versus disease), (B) study design (cross-sectional versus longitudinal), (C) adjustment (adjusted versus unadjusted associations), (D) device location (accelerometer versus pedometer), and (E) device wearing location. (A) population selection: ● general, ○ disease, (B) study design: ● cross-sectional, ○ longitudinal, (C) adjustment: ● adjusted, ○ unadjusted, (D) device type ● accelerometer, ○ pedometer, (E) device wearing location: ● (green) wrist, ● (pink) triceps, ● (yellow) hip. β = ±0.10, β = ±0.20, β = ±0.30.

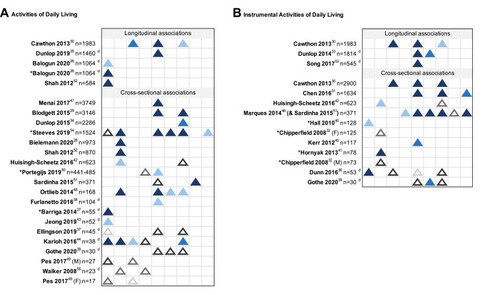
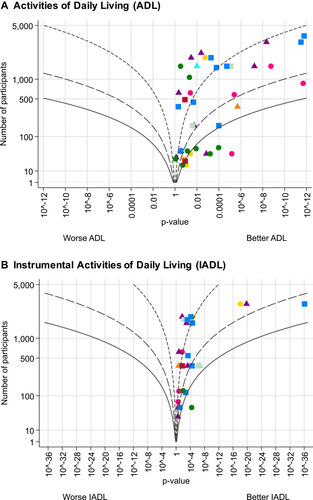
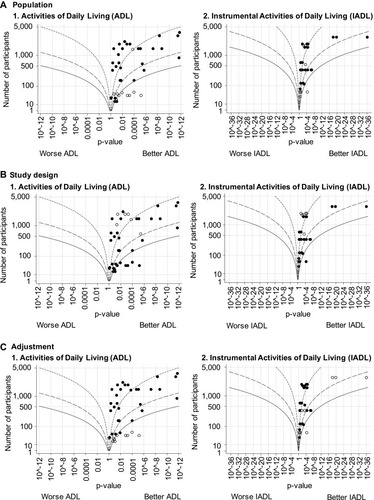
Table 6 Associations of Objectively Measured Physical Activity and Sedentary Behavior with Activities of Daily Living and Instrumental Activities of Daily Living in Community-Dwelling Older Adults, Stratified by Domain