Figures & data
Table 1 The Characteristics of the Study Population
Figure 1 Median time interval between two consecutive hospitalizations. Median time intervals between consecutive hospital readmissions. The rank of the hospital stay corresponds to the ordered number of the readmission (1: time between the start date of the index hospitalization and the start date of the first hospital readmission, 2: the time between the start date of the first hospital readmission and the start date of the second hospital readmission, etc.).
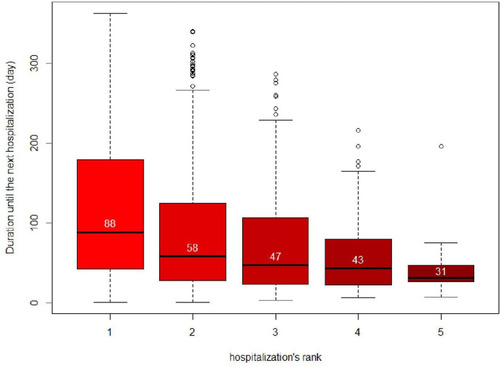
Table 2 Multivariate Analyses of the Risk of Hospital Readmission (Using a Frailty Model) and the Risk of Death (Using a Time-Dependent Cox Regression Model) in the Study Population (N=3081 Patients)
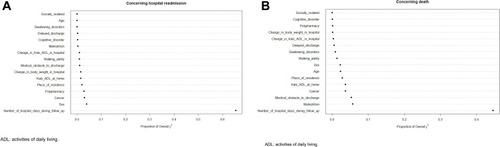
Figure 2 Importance of the variables of the model in the prediction of the risks of hospital readmission and death. Wald’s test was performed. Each variable in the model was tested against the empty model, in order to determine which best predicted the risks of hospital readmission and death. The variable “Number of previous hospitalizations” was the most predictive for the two outcomes, as shown below. The proportion of the overall chi-square for each variable was calculated as a proportion of the sum of chi-squared statistics, obtained from Wald tests for each variable separately.