Figures & data
Figure 1 Study flow-chart.
Abbreviations: TBAD, type B aortic dissection; TEVAR, thoracic endovascular aortic repair.
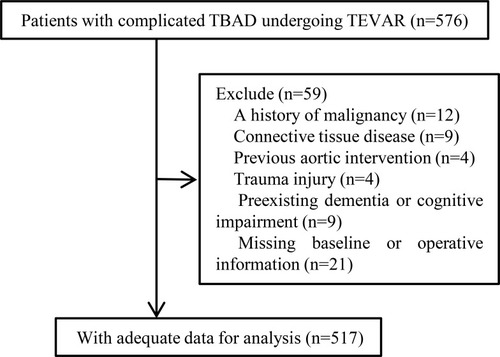
Table 1 Baseline and Operative Characteristics of Patients with and without Delirium
Figure 2 Forest plot of POD predictors (A), and multivariable analysis results of follow-up mortality (B).
Abbreviations: POD, postoperative delirium; BMI, body mass index.
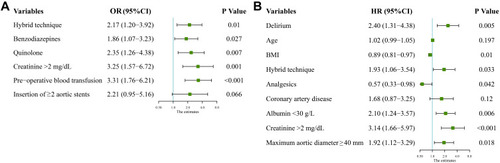
Table 2 Post-Operative Outcomes of Patients with and without Delirium
Table 3 Results of Multivariate Regression Analysis for Early Outcomes
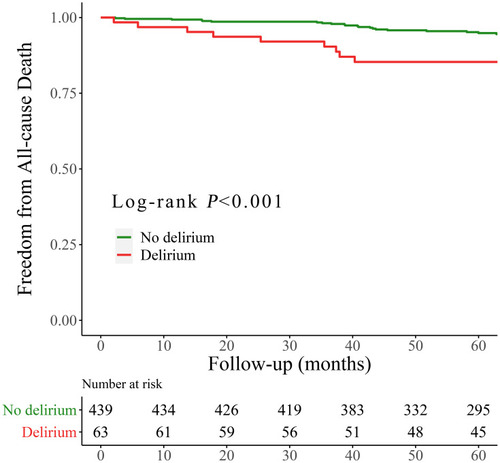
Figure 3 The Kaplan-Meier survival curve of the association between postoperative delirium and follow-up survival.