Figures & data
Table 1 Characteristics of Participants
Table 2 Age-Sex Adjusted Partial Correlation of LAP with CVD Risk Factors
Table 3 Univariate Logistic Regression for Risk of TOD According to LAP Quartiles
Table 4 Multivariable Logistic Regression for Risk of TOD According to LAP Quartiles
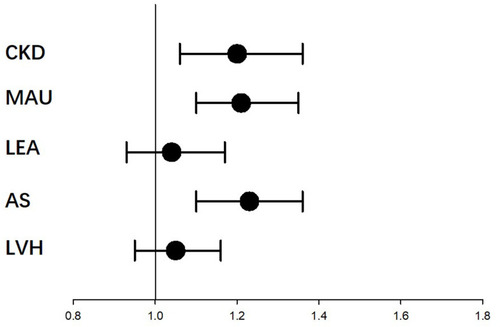
Figure 1 Univariate logistic regression for risk of TOD according to the 1 SD increasement of the LAP. For participants with 1-SD increasement of LAP, they have significant added risk of LVH, AS, LEA, CKD, MAU.
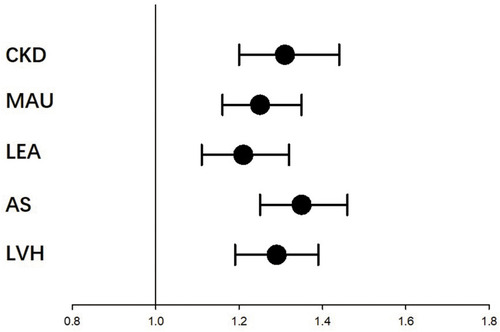
Figure 2 Multivariate logistic regression for risk of TOD according to the 1 SD increasement of the LAP. For participants with 1-SD increasement of LAP, they have significant added risk of AS, CKD, MAU; but not LVH or LEA. Adjusted age, sex, hypertension, use of antihypertensive, diabetes, BMI, smoking habit, HDL-C, LDL-C, family history of premature CVD.