
Figures & data
Table 1 Patient’s Demographic and Clinical Characteristics
Figure 1 An 80-year-old man with spine metastases treated with PVP and suffered from intra-spinal canal cement leakage (before surgery). (A) Preoperative anteroposterior thoracic vertebral radiography showed vertebral collapse at T10 and L1; (B) Preoperative anteroposterior lumbar vertebral radiography revealed vertebral collapse at L1; (C) Preoperative lateral thoracic vertebral radiography showed vertebral collapse at T10 and L1; (D). Preoperative lateral lumbar vertebral radiography showed vertebral collapse at L1; (E) Preoperative sagittal thoracic vertebral MRI showed multiple spine metastases and vertebral collapse at T10 and L1; (F) Preoperative sagittal lumbar vertebral MRI showed multiple spine metastases and vertebral collapse at T10 and L1; (G) Preoperative transversal T10 MRI showed deformation of the dural sac, but no spinal cord or nerve root compression; (H) Preoperative transversal MRI at T11 showed metastatic lesion; (I) Preoperative transversal MRI at T12 showed metastatic lesion; (J) Preoperative transversal MRI at L1 showed metastatic lesion; (K) Preoperative transversal MRI at L2 showed metastatic lesion; (L) Preoperative transversal MRI at L5 showed metastatic lesion; (M) Postoperative anteroposterior lumbar vertebral radiography revealed bone cement at T10, T11, T12, L1, L2, and L5; (N) Postoperative lateral vertebral radiography showed bone cement at T10, T11, T12, L1, L2, and L5; (O) Postoperative transversal CT at T10 showed distribution of bone cement; (P) Postoperative transversal CT at T11 showed intra-spinal canal cement leakage; (Q) Postoperative transversal CT at T12 showed intra-spinal canal cement leakage; (R) Postoperative transversal CT at L1 showed intra-spinal canal cement leakage.
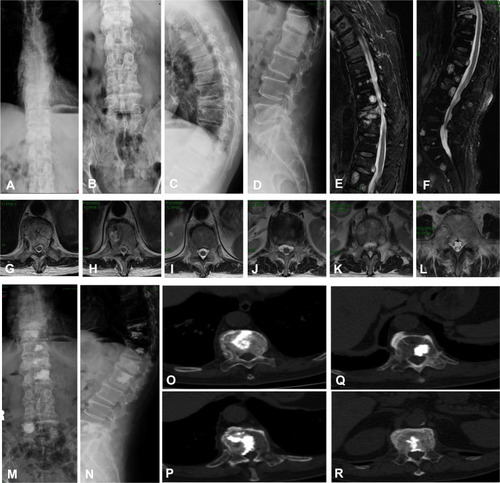
Table 2 Multivariate Logistic Regression Analyses of Potential Risk Variables for Predicting Intra-Spinal Canal Cement Leakage in Patients with Spine Metastases Treated with Percutaneous Vertebroplasty in the Training Group
Table 3 The Nomogram to Calculate the Probability of Intra-Spinal Canal Cement Leaks in Patients with Spine Metastases
Table 4 Predictive Performance of the Nomogram
Figure 2 The area under the receiver operating characteristic (AUROC) curve for the nomogram: (A) the training group; (B) the validation group; (C) the both group.
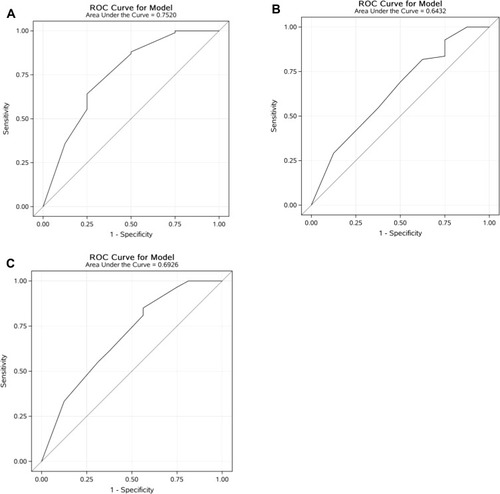
Figure 3 Box plots of predicted probabilities for the nomogram: (A) the training group; (B) the validation group; (C) the both group combined. Discrimination slope was the difference between the mean predicted probability with (positive events) and without (negative events) intra-spinal canal cement leakage. Black solid dots indicate the mean value of the predicted probability of intra-spinal canal cement leakage.
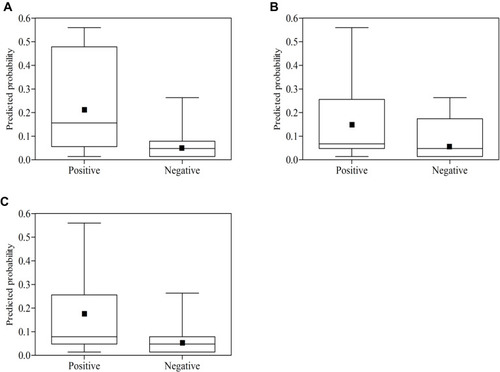
Figure 4 Plotting deciles of the predicted probability of intra-spinal canal cement leakage against the observed proportions for the nomogram: (A) the training group; (B) the validation group; (C) the both groups combined. The x-axis is the predicted risk and the y-axis is the actual risk. The grey dotted lines indicate a perfect prediction by an ideal model. The solid black lines indicate the performance of the nomogram, and a closer fit to the diagonal dotted lines indicate a better prediction.
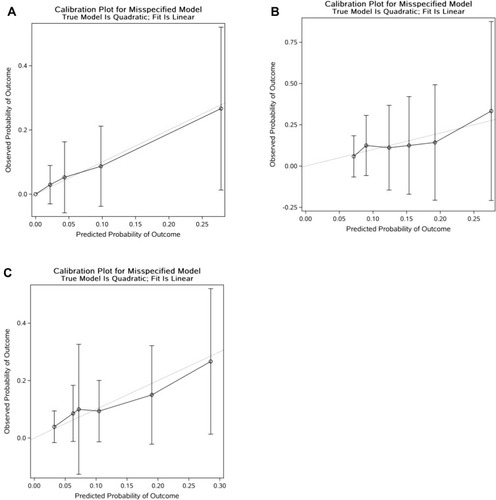
Table 5 Subgroup Analysis of Patients with Spine Metastases According to the Predicted Probability of Intra-Spinal Canal Cement Leaks