Figures & data
Figure 1 Schematic outline of part 1 and part 2 of study using low-dose pine bark extract.
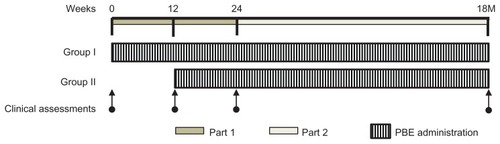
Table 1 Baseline demographics of randomized groups (phase I, low-dose PBE trial)
Table 2 Score assessments of questionnaire survey (high-dose PBE trial, N = 24)
Table 3A Score assessments of questionnaire survey for group I (phase I, low-dose PBE trial, N = 38)
Table 3B Score assessments of questionnaire survey for group II (phase I, low-dose PBE trial, N = 39)
Table 4 Score assessment of questionnaire survey for 18-month PBE administration (phase II, low-dose PBE trial, N = 21)
Table 5 Physical examination scores (phase I, low-dose PBE trial)
Figure 2 Before (left) and 6 months after (right) treatment of photodamaged skin with oral pine bark extract.
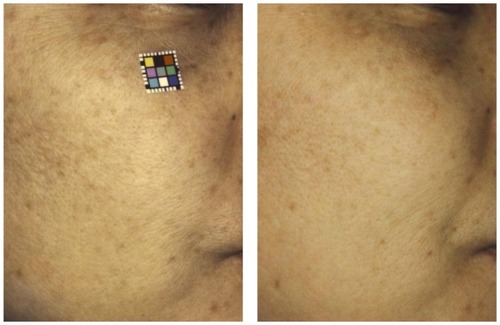
Table 6 Physical examination scores (phase II, low-dose PBE trial, N = 21)
Table 7A Overall efficacy rate after 24-week low-dose PBE administration (phase I, low-dose PBE trial)
Table 7B Overall efficacy rate after 18-month low-dose PBE administration (phase II, low-dose PBE trial)
Figure 3 The melanin index was significantly decreased after 4 and 12 weeks of oral administration of pine bark extract 100 mg/day.
Notes: The melanin index was calculated according to the method reported by Yamamoto et al.Citation31 Values are expressed as the mean ± standard deviation. *P < 0.05 (Tukey–Kramer method), n = 24.
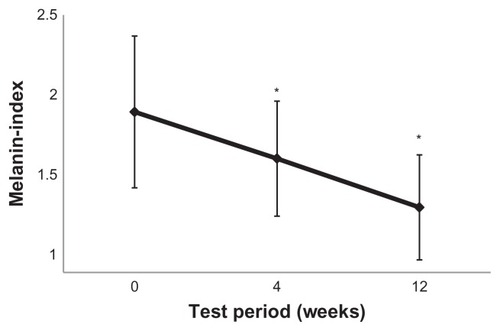
Figure 4 Time course of mean melanin index changes in age spots in group 1 (A) and group 2 (B).
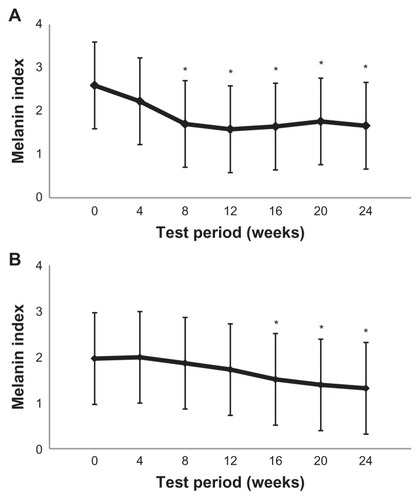
Figure 5 Facultative skin color was assessed using a colorimeter followed by individual typology angle value calculation.
Abbreviation: ITA, individual typology angle.
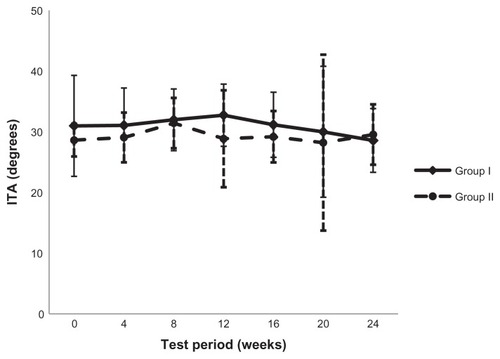
Figure 6 Time course of corneocyte size changes measured by a planimetric method during pine bark extract administration.
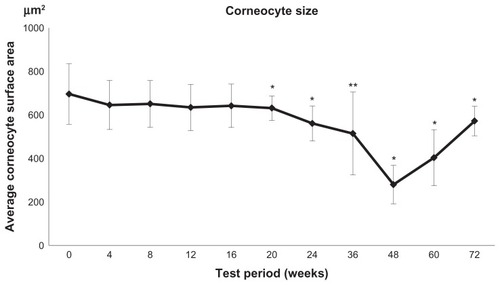
Table 8A Results of hematology in 24 evaluated cases (high-dose PBE trial, 12-week administration)
Table 8B Results of hematology in 21 evaluated cases (phase II, low-dose PBE trial, 18-month administration)
Table 9A Results of blood chemistry in 24 evaluated cases (high dose PBE trial, 12-week administration)
Table 9B Results of blood chemistry in 21 evaluated cases (phase II, low-dose PBE trial, 18-month administration)