Figures & data
Table 1 General Characteristics of the Patients
Figure 1 Bar charts of non-survivor and survivor counts in older adults with CAP by different scores among four scoring systems. Each chart shows the proportion in CURB-65, MEWS, qSOFA and NEWS, respectively.
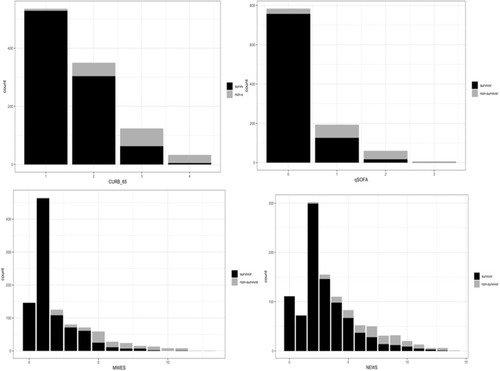
Figure 2 Bar charts of non-ICU and ICU counts in older adults with CAP by different scores among four scoring systems. Each chart shows the proportion in CURB-65, MEWS, qSOFA and NEWS, respectively.
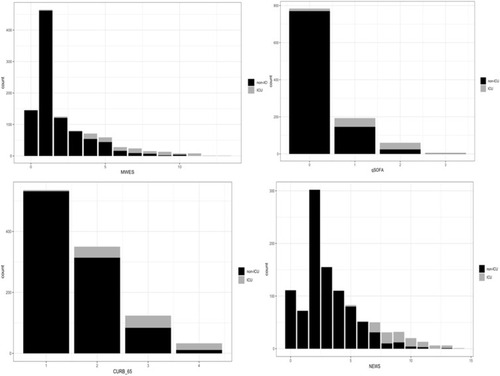
Table 2 The Multivariable Logistic Model for Mortality
Table 3 The Multivariable Logistic Model for ICU Admission
Table 4 The AUC of Predictive Factors for Mortality
Figure 3 Receiver operating characteristic (ROC) curves and corresponding area under the curve (AUC) statistics for the risk of the mortality in older CAP by CURB-65, qSOFA, MEWS and NEWS scoring systems. The cutoff value, sensitivity and specificity of CURB-65, qSOFA, MEWS and NEWS were (362.68%, 92.45%),(180.99%, 84.02%), (4, 80.28%, 87.36%), (5, 83.1%, 80.49%), respectively.
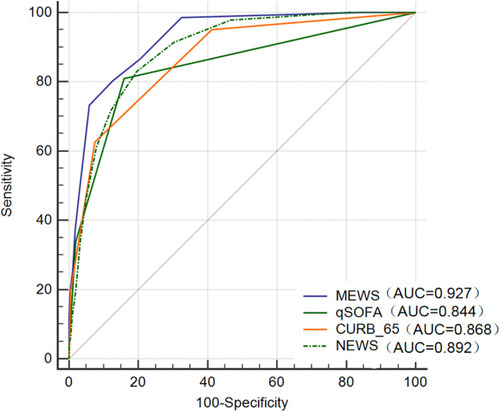
Figure 4 Receiver operating characteristic (ROC) curves and corresponding area under the curve (AUC) statistics for the risk of the Intensive Care Unit (ICU) admission in older CAP by CURB-65, qSOFA, MEWS and NEWS scoring systems. The cutoff value, sensitivity and specificity of CURB-65, qSOFA, MEWS and NEWS were (2, 96.08%, 56.54%), (1, 86.27%, 81.83%), (4, 90.2%, 85.56%), (7, 96.08%, 95.52%), respectively.
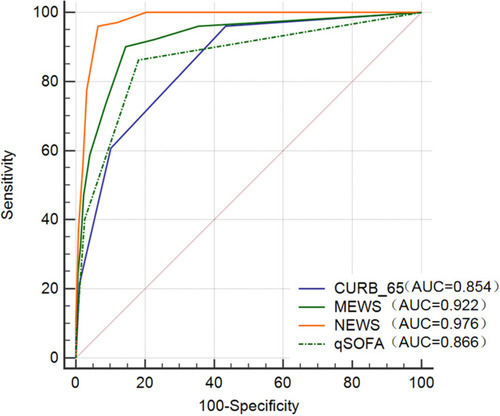
Table 5 The Cutoff Value of Predictive Factors for Mortality
Table 6 The AUC of Predictive Factors for ICU Admission
Table 7 The Cutoff Value of Predictive Factors for ICU Admission
Table 8 Comparison of ROC for Mortality
Figure 5 Comparison of ROC and AUC for selection of better scoring system to predict mortality in older CAP.
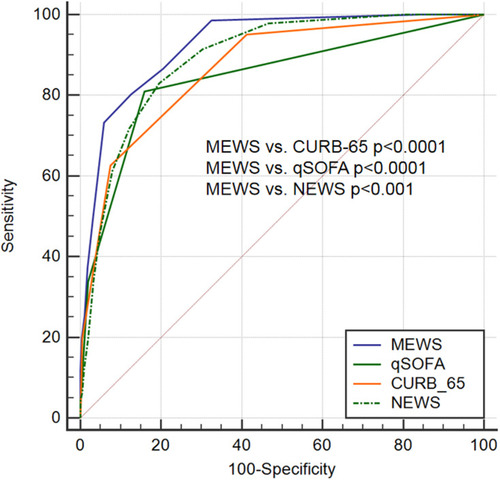
Table 9 Comparison of ROC for ICU Admission
Figure 6 Comparison of ROC and AUC for selection of better scoring system to predict ICU admission in older CAP.
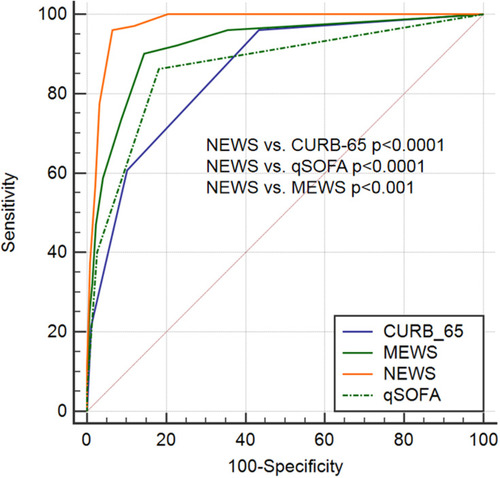
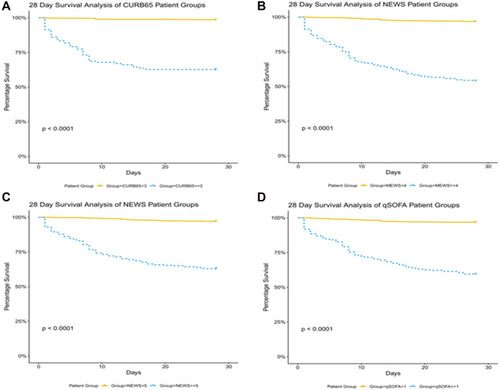
Figure 7 Kaplan–Meier estimates of 28-day overall survival. Panel (A), analysis with CURB65 system, cutoff = 3; Panel (B), analysis with MEWS system, cutoff = 4; Panel (C), analysis with NEWS system, cutoff = 5; Panel (D), analysis with qSOFA system, cutoff = 1.