Figures & data
Table 1 Baseline Demographic and Clinical Characteristics Among the Three Average SBP Groups
Table 2 Rate of Clinical Outcomes Among the Tthree Different Baseline SBP Groups and Among the Three Different Average SBP Groups
Figure 1 Rate of ischemic stroke/transient ischemic attack (TIA), intracerebral hemorrhage (ICH), and death compared among the three average systolic blood pressure (SBP) groups (<120, 120–140, and ≥140 mmHg).
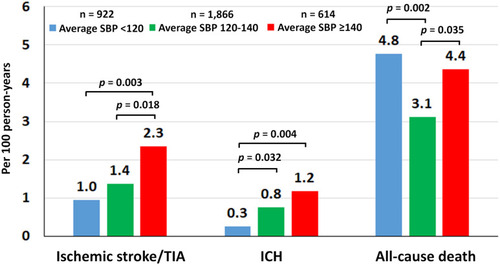
Figure 2 (A) Cumulative event rate over time for ischemic stroke/transient ischemic attack (TIA), (B) intracerebral hemorrhage (ICH), and (C) death (C) among the three average systolic blood pressure (SBP) groups (<120, 120–140, and ≥140 mmHg).
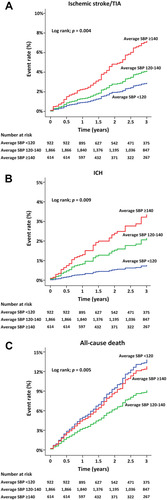
Figure 3 Hazard ratio (HR) and 95% confidence interval (CI) for (A) ischemic stroke/transient ischemic attack (TIA), (B) intracerebral hemorrhage (ICH), and (C) death (C) among the three average systolic blood pressure (SBP) groups (<120, 120–140, and ≥140 mmHg) with and without adjustment for baseline and time-varying covariates.
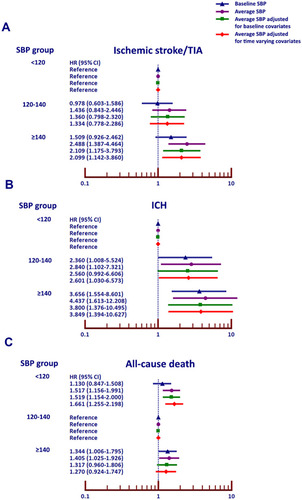
Figure 4 Cubic spline graph showing the adjusted hazard ratio (HR) and 95% confidence interval (CI) for (A) ischemic stroke/transient ischemic attack (TIA), (B) intracerebral hemorrhage (ICH), and (C) death relative to average systolic blood pressure (SBP) as a continuous variable.
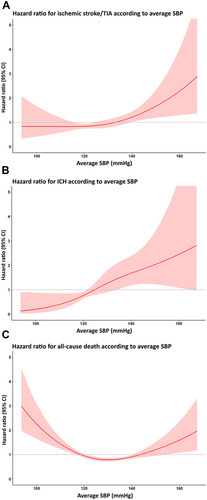
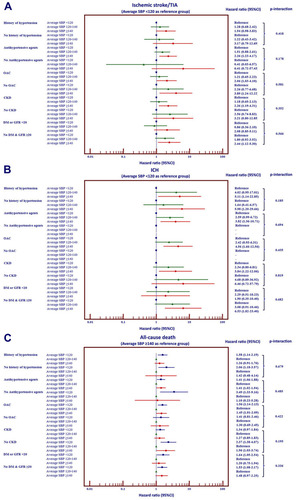
Figure 5 Forest plot of Hazard ratio and 95% confidence interval selected subgroups of patients with atrial fibrillation on clinical outcomes (A–C).