Figures & data
Table 1 Changes in activities of daily living (ADL) functioning broken down by sex, age, marital status, education, and included subitems
Table 2 Comparison of mean Life Satisfaction Index A (LSI-A) value at reexamination for unchanged, impaired, and improved activities of daily living (ADL) stratified by sex, age, marital status and education
Table 3 Comparison of means of Life Satisfaction Index A (LSI-A, range 0–40) at reexamination and variables at baseline examination
Table 4 Correlations between LSI-A at reexamination and parameters from baseline examination
Table 5 A multiple linear regression model with independent variables from baseline examination and Life Satisfaction Index 3 years later as dependent variable
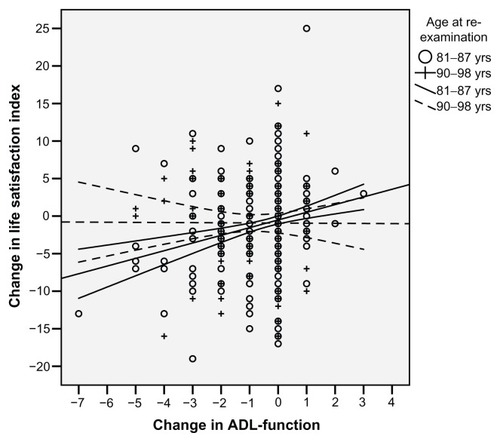
Figure 1 Change in Life Satisfaction Index A (LSI-A) from baseline to reexamination depending on change in activities of daily living (ADL) in the same period between the younger and the older group (P = 0.0273).