Figures & data
Table 1 Charlson Comorbidity Index with International Classification of Diseases (ICD-10) Coding
Figure 1 Flow diagram of the screening and enrollment of study participants.
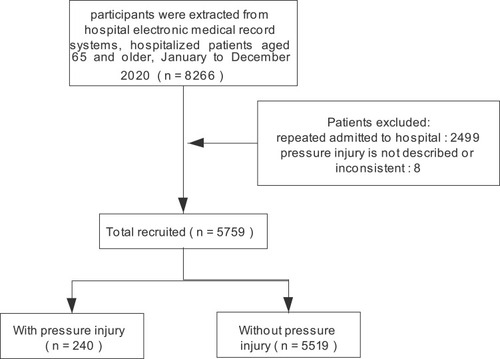
Table 2 Differences in Baseline Characteristics Between without Pressure Injury and with Pressure Injury
Table 3 Univariate Analysis of Community-Acquired Pressure Injury
Table 4 Association Between Charlson Comorbidity Index and Occurrence Pressure Injury in Regression Model
Figure 2 Association between CCI and risk of CAPI. The black solid curve represents the odds ratio, and the gray area indicates its 95% confidence interval.
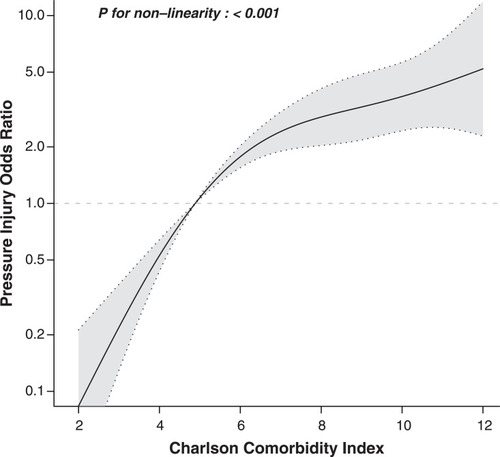
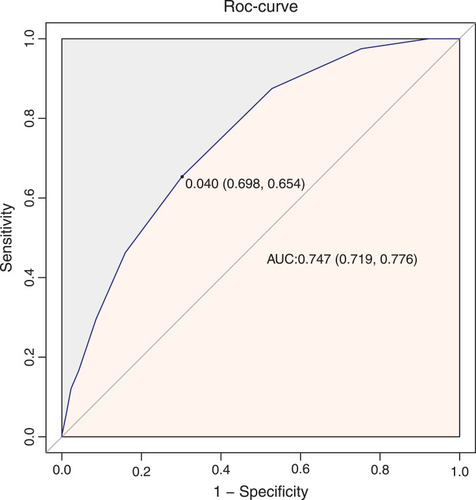
Figure 3 Receiver operating characteristic (ROC) curve of CAPI and CCI, constructed to evaluate the sensitivity and 1-specificity of CCI in the predict CAPI.