Figures & data
Table 1 Baseline Characteristics of the Study Population
Table 2 Association Between SIRI and Clinical Outcomes of in Critically Ill Patients with Stroke
Figure 1 The relationship between systemic inflammatory response index (SIRI) and all-cause mortality. (A) 30-day mortality. (B) 90-day mortality. (C) one year mortality.
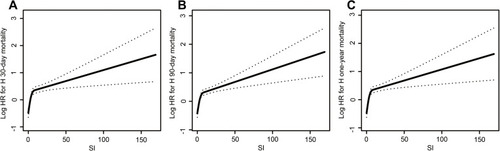
Table 3 Association Between SIRI and Clinical Outcomes of Sepsis
Table 4 Subgroup Analysis of the Associations Between 90-Day All-Cause Mortality and the SIRIa
Table 5 Receiver Operating Curve (ROC) for Prediction in Stroke Patients
Figure 2 Receiver operating curve (ROC) for prediction in stroke patients using systemic inflammatory response index (SIRI). (AUC: SIRI: 0.622; RDW: 0.587; PLR:0.563; LMR: 0.558; NLR:0.535, separately).
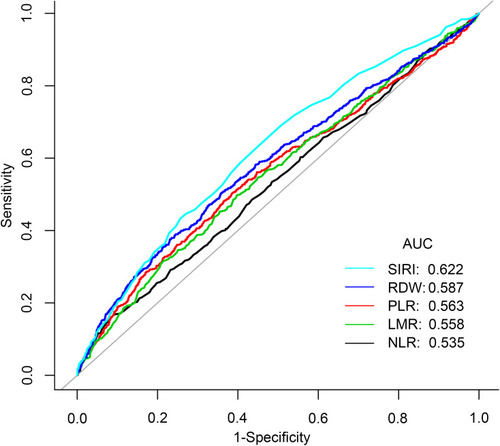
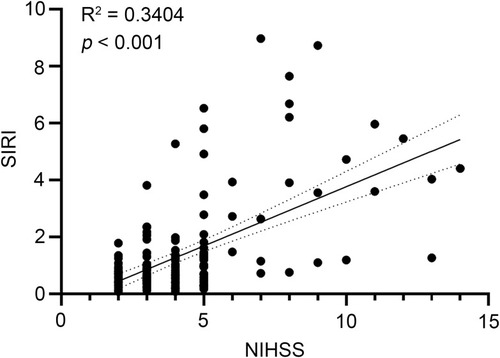
Figure 3 Pearson’s correlation test to analyze the relationship between systemic inflammatory response index (SIRI) and National Institute of Health stroke scale (NIHSS). (R2 = 0.3404, p < 0.001).