Figures & data
Table 1 Baseline Characteristics of Participants in the Control and Intervention Groups (N = 264)
Table 2 Mean (95% CI) Costs (€) of Healthcare Utilization per Participant in the Control and Intervention Group, and Adjusted Mean Cost Differences Between Study Groups for the Within-Trial Period (12 Months) (Estimates Obtained After Imputation)
Table 3 Mean (95% CI) Volumes of Healthcare Utilization per Participant in the Control and Intervention Group, and Adjusted Mean Volume Differences Between Study Groups for the Within-Trial Period (12 Months) (Estimates Obtained After Imputation)
Table 4 Mean (95% CI) Effects for Sedentary Time, EQ-5D-5L Values, and QALYs per Participant in the Control and Intervention Group at Baseline, 6, and 12 Months, and Adjusted Mean Differences Between Study Groups During the 12-Month Follow-Up Period (Estimates Obtained After Imputation)
Table 5 Differences in Pooled Mean Incremental Costs and Effects (95% CIs), Incremental Cost-Effectiveness Ratios, and the Distribution of Incremental Cost-Effect Pairs Around the Quadrant of the Cost-Effectiveness Planes for the Base-Case and Sensitivity Analyses
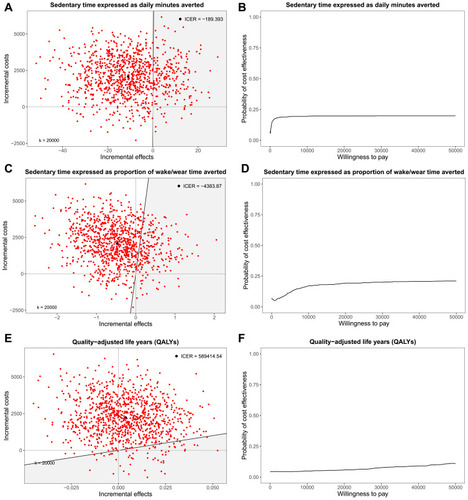
Figure 1 Cost-effectiveness planes (CE-planes) and cost-effectiveness acceptability curves (CEACs) for total societal costs and sedentary time expressed as daily minutes averted (A and B), sedentary time expressed as proportion of wake/wear time averted (C and D), and quality-adjusted life years (QALYs) (E and F), respectively. The shaded area in the CE-planes correspond to the area such that points lying there indicate that the intervention is cost-effective compared to control based on a willingness to pay of €20,000/unit of effect gained. ![]()