Figures & data
Table 1 Recommended Energy Intake Standards for Dietary Nutrients for Chinese Residents (2013 Edition)
Table 2 Characteristics of Participants in Different Age Groups and Different Isocaloric Diet Groups
Figure 1 PCA scores plot and validation plot of permutation testing of PLS-DA model. (A and B) PCA scores plot generated from serum samples of participants and QC in positive and negative mode. Purple triangle, QC. Light blue diamond, Sample. (C and D) The validation plot of permutation testing of PLS-DA model. (E and F) PLS-DA score plots generated from serum samples of participants in different age groups. Green dot, young group. Blue box, middle-aged group. Crimson triangle, old-aged group. (A, C and E) the positive mode. (B, D and F) the negative mode.
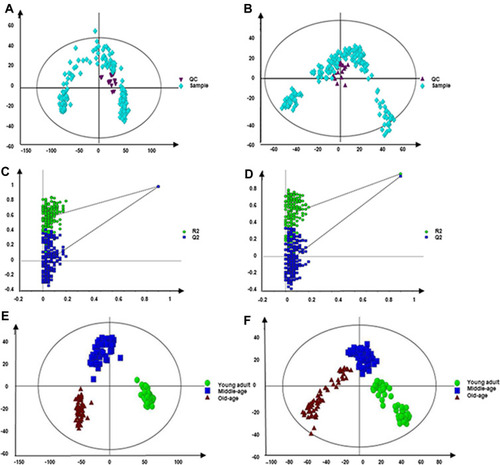
Figure 2 PLS-DA score plots generated from serum samples of participants in different diet groups. (A–C) The positive ESI mode. (D–F) The negative ESI mode.
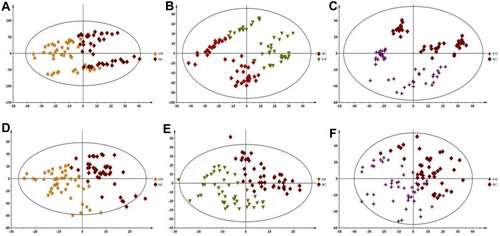
Table 3 Ionic Strength of 18 Potential Life-Related Biomarkers in Different Age Groups and Different Isocaloric Diet Groups
Figure 3 ROC curves of 18 potential biomarkers in young adult group vs old-age group. 18 potential biomarkers include LysoPC (20:1) (AUC=0.923), γ-aminobutyric acid (AUC=0.971), L-valine (AUC=0.983), L-threonine (AUC=1), aminoadipic acid (AUC=0.939), leukotriene F4 (AUC=0.965), taurocholic acid (AUC=0.746), serotonin (AUC=0.738), LysoPE (18:2) (AUC=1), succinic acid (AUC=0.979), glycocholic acid (AUC=0.982), cis-Aconitic acid (AUC=0.973), methionine sulfoxide (AUC=0.998), LysoPC (O-18:0) (AUC=1), LysoPC (20:4) (AUC=0.837), 9,10-DiHODE (AUC=0.92), 12,13- DHOME (AUC=0.948), and deoxycholic acid (AUC=0.7130).
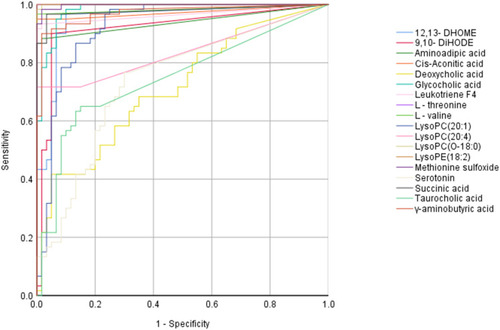
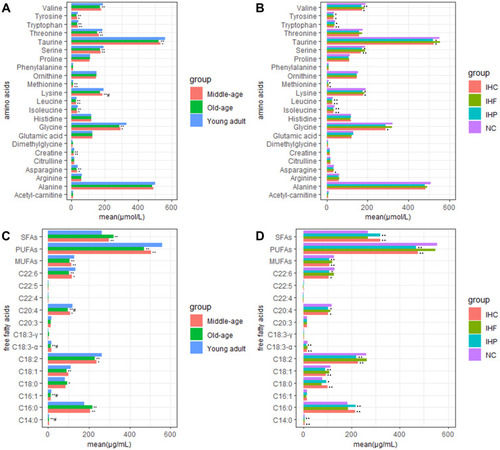
Figure 4 One-way ANOVA followed by Dunnett post hoc test of different age groups and diet groups. (A) Comparison of amino acids concentrations in different age groups. (B) Comparison of amino acids concentration in different isocaloric dietary groups. (C) Comparison of free fatty acids concentrations in different age groups. (D) Comparison of free fatty acids concentrations in different isocaloric dietary groups. *P<0.05, **P<0.01 vs young adult group. #P<0.05 vs middle-age group. ▲P<0.05, ▲▲P<0.01 vs normal control group.