Figures & data
Figure 1 Injection sites: A, procerus muscle; B, right medial corrugator muscle; C, left medial corrugator muscle; D, right lateral corrugator muscle; E, left lateral corrugator muscle.
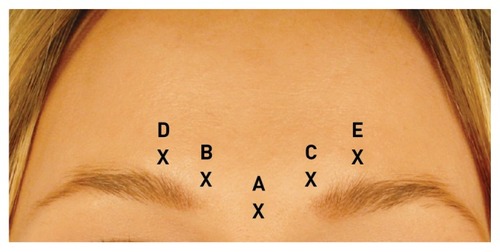
Table 1 Patient demographics
Figure 2 Percentage of responders over time (A) when a responder was defined as a patient with at least a 1-point improvement from baseline at rest and at maximum frown; (B) when a responder was defined as a patient with at least a 2-point improvement from baseline at maximum frown.
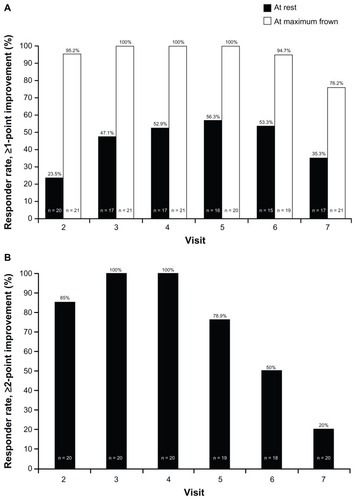
Figure 3 Mean change from baseline glabellar frown lines score on the 5-point scale at maximum frown over time.
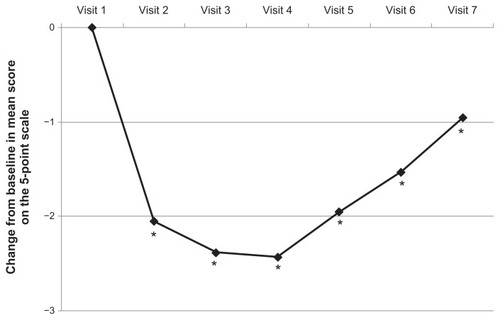
Table 2 Percentage of patients who assessed themselves as having “improved” or “markedly improved” glabellar frown lines compared with baseline
Table 3 Patient questionnaire responses: mean percentage of patients who agreed with the statements at the time points shown