Figures & data
Figure 1 Study flow diagram.
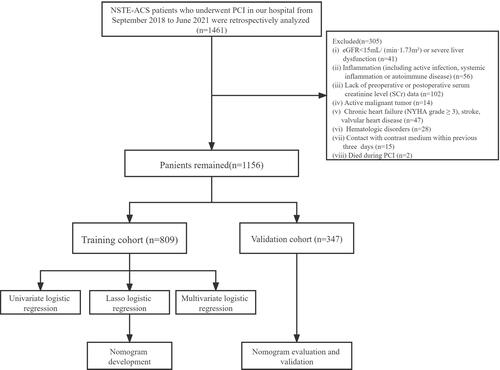
Table 1 Comparison of Baseline Features and PCI Results in the Training Cohort
Table 2 Comparison of Laboratory Test Results in the Training Cohort
Table 3 Multivariate Logistic Regression Analysis for the Occurrence of CI-AKI After PCI in Patients with NSTE-ACS in Training Cohort
Figure 2 LASSO regression model screening predictors. (A) Vertical lines are plotted at the most available parameter value λ = 0.0105, and the selected variables are 15; (B) Plot of each clinical characteristic coefficient against log(λ) by adjusting the parameter λ.
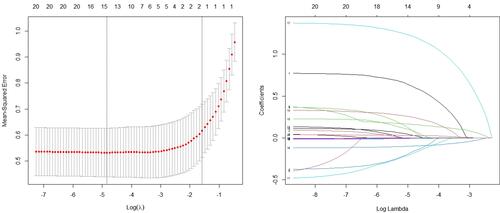
Figure 3 The nomogram for predicting the occurrence of CI-AKI after PCI in patients with NSTE-ACS. The final score (ie, total points) is calculated as the sum of the individual scores of each of the six variables included in the nomogram.
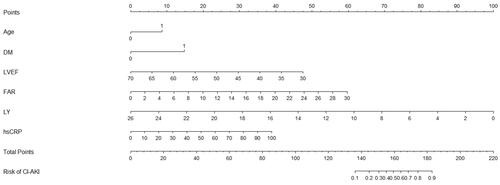
Figure 4 Calibration curve of the nomogram for the training set (A) and the validation set (B). The X-axis represents the overall predicted probability of CI-AKI after PCI and the Y -axis represents the actual probability. Model calibration is indicated by the degree of fitting of the curve and the diagonal.
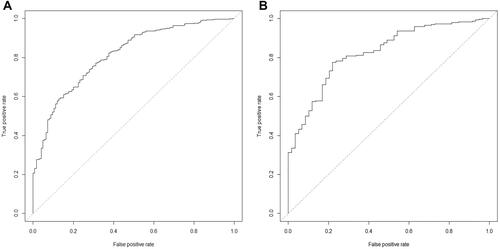
Figure 5 ROC curve of the nomogram for predicting CI-AKI after PCI in NSTE-ACS patients. (A) ROC curve in the training set; (B) ROC curve in the validation set.
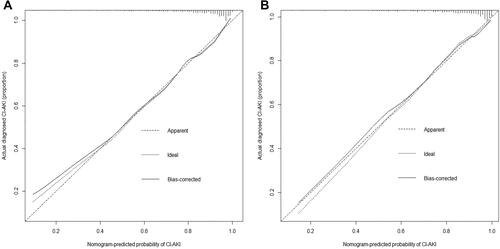
Figure 6 The receiver operator characteristic curves of the nomogram and the Mehran Score.
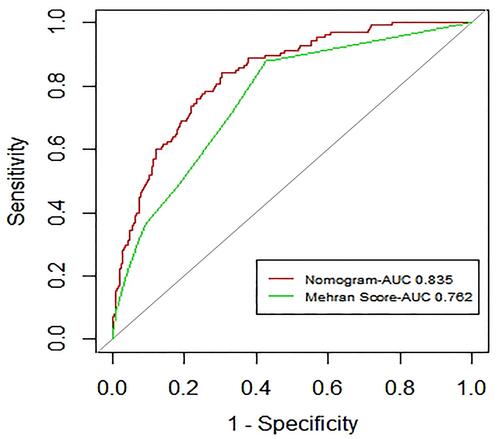
Figure 7 Decision curve analysis for the training set (A) and the validation set (B). A horizontal line indicates that all samples are negative and not treated, with a net benefit of zero. An oblique line indicates that all samples are positive. The net benefit has a negative slope.
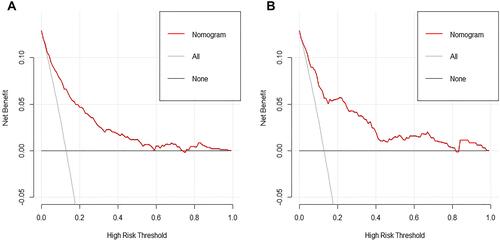
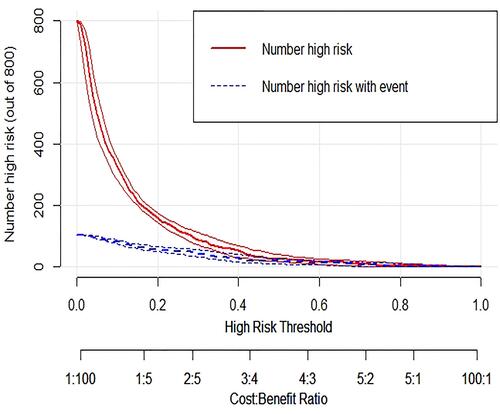
Figure 8 The clinical impact curve of the validation cohort is drawn based on the nomogram. Clinical impact curve of the nomogram plots the number of CI-AKI patients classified as high risk, and the number of cases classified as high risk with the event at each risk threshold.