
Figures & data
Table 1 Participant Characteristics
Figure 1 Scatterplot of weighted nutrition and physical activity scores. Marker size (scale) represents the number of participants.
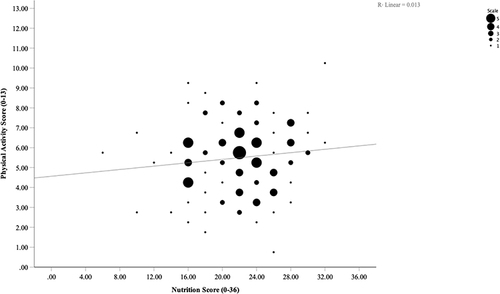
Table 2 The Association of Knowledge of (a) Nutrition and (b) Physical Activity Guidelines with Physical Function and Physical Activity
Table 3 The Association of Knowledge in (a) at Least One Domain and (b) Knowledge in Both Domainsa with Physical Function and Physical Activity