
Figures & data
Table 1 Baseline Characteristics of the Study Population
Figure 1 Average bone mineral density (BMD) at the total hip (TH), femoral neck (FN), and lumbar spine (LS) in 10-year age subgroups. P for trend according to the 10-year age subgroups using linear trend test.
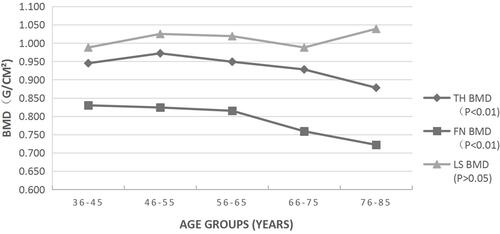
Figure 2 Average bone mineral density (BMD) from L1 to L4 separately in 10-year age subgroups. P for trend according to the 10-year age subgroups using linear trend test.
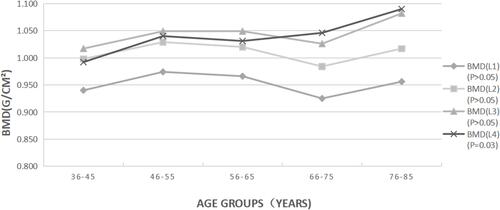
Figure 3 Average trabecular bone score (TBS) at the lumbar spine (LS) in 10-year age subgroups. P for trend according to the 10-year age subgroups using quadratic term trend test.
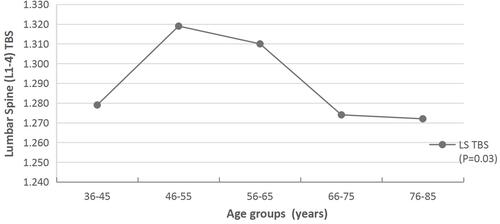
Table 2 Average Annual Change Rate (%/Year) of BMD at Each Site and LS TBS in 10-Year Age Subgroups