Figures & data
Table 1 Patient characteristics
Table 2 Overall performances of eGFR and sGFR
Table 3 AUCs, sensitivity, and specificity of eGFR for the diagnosis of moderate renal failure (GFR < 60 mL/min/1.73 m2)
Figure 1 Bland–Altman plot of eGFR and sGFR (mL/min/1.73 m2). Solid line represents the mean of difference between methods; dashed lines represent 95% limits of agreement of the mean of difference between methods. (A–F) Represent for the GFR results estimated using Cockcroft–Gault equation, six-variable MDRD equation, four-variable MDRD equation, CKD-EPI equation, Jelliffe-1973 equation, and Hull equation, respectively.
Abbreviations: CKD-EPI, Chronic Kidney Disease Epidemiology Collaboration; eGFR, estimated glomerular filtration rate; sGFR, standard glomerular filtration rate; MDRD, Modification of Diet in Renal Disease.
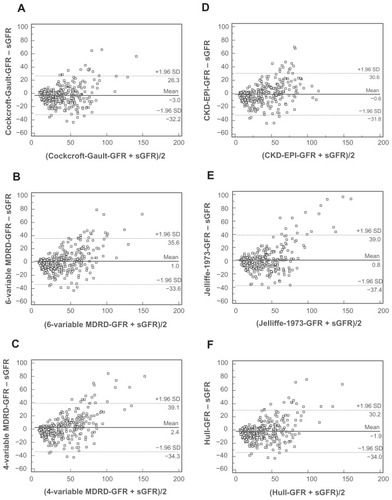
Figure 2 Receiver operating characteristic curves of eGFR for the diagnosis of moderate renal failure (GFR < 60 mL/min/1.73 m2).
Abbreviations: CKD-EPI, Chronic Kidney Disease Epidemiology Collaboration; eGFR, estimated glomerular filtration rate; sGFR, standard glomerular filtration rate; MDRD, Modification of Diet in Renal Disease.
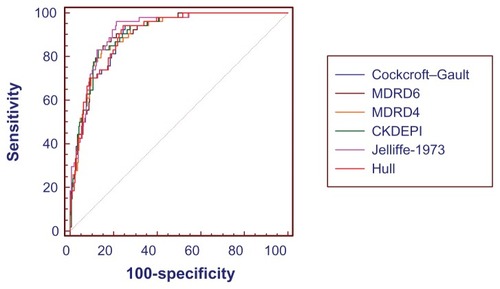
Table 4 Performances of eGFR and sGFR in the different stages of CKD