Figures & data
Table 1 Daily activity scenarios characteristics in protocols 1 (P1) and 2 (P2)
Table 2 Observable criteria used to annotate video sequences of the protocol 2 (P2)
Table 3 Characteristics of the participants in protocol 1 (P1)
Table 4 Characteristics of the participants in protocol 2 (P2)
Table 5 Evaluation of predictive performance of our assessment methodology based on the DAS scores: Leave-one-out cross-validation (LOOCV) resultsTable Footnotea
Table 6 Spearman’s correlation coefficients between DAS.,n() scores with Diagnosis, MMSE and IADL-E
Figure 1 DAS.,P1 scores for AD patients and NC participants for protocol 1 (P1). The first line (A) represents the ratio of efficacy for the two groups (Grey dots for NC and Black dots for AD). Then the next lines (B–E) show the evolution of the index from ratio of efficacy (index 0) to DAS.,P1 score (index 4) including omission (B), repetition (C), order error (D), and bad completion at the first attempt (E). Measurements represented for each participant j: (A) REff = Index0,P1(j) (Percentage of time spent in the room to behave directed to perform a listed activities). (B)
(impact of omission mistakes on the REff). (C)
(cumulative impact of omission and repetition mistakes on the REff). (D)
(cumulative impact of omission, repetition, and order mistakes on the REff). (E) Final DAS score
(cumulative impact of omission, repetition, order mistakes, and bad completion at the first attempt on the REff).
![Figure 1 DAS.,P1 scores for AD patients and NC participants for protocol 1 (P1). The first line (A) represents the ratio of efficacy for the two groups (Grey dots for NC and Black dots for AD). Then the next lines (B–E) show the evolution of the index from ratio of efficacy (index 0) to DAS.,P1 score (index 4) including omission (B), repetition (C), order error (D), and bad completion at the first attempt (E). Measurements represented for each participant j: (A) REff = Index0,P1(j) (Percentage of time spent in the room to behave directed to perform a listed activities). (B) Index1,P1(j)=[REff(j)]×∏i=14k1,P1a1,F (impact of omission mistakes on the REff). (C) Index2,P1(j)=[REff(j)]×∏i=14k1,P1a1,F1(j) (cumulative impact of omission and repetition mistakes on the REff). (D) Index3,P1(j)=[REff(j)]×∏i=12k1,P2a1,F2(j) (cumulative impact of omission, repetition, and order mistakes on the REff). (E) Final DAS score Sj,P1(k1,P1, k2,P1, k3,P1, k4,P1,) (j)=[REff(j)]×∏i=14k1,P1a1,F1 (j) (cumulative impact of omission, repetition, order mistakes, and bad completion at the first attempt on the REff).](/cms/asset/743098ae-0b15-4ed9-9665-acd125a0ac66/dcia_a_36297_f0001_b.jpg)
Figure 2 Performance evaluation of the assessment methodology to classify observation data as AD group or NC group. (A) Specificity and sensitivity in function of the cutoff point of DAS.,P1() scores. (B) Receiver operating curve associated with protocol 1.
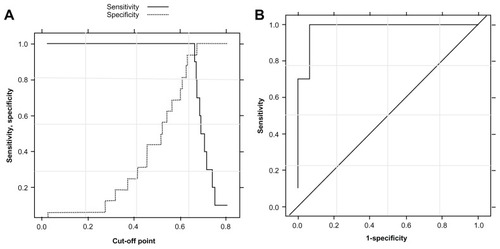
Figure 3 DAS.,P2 scores for MCI patients and NC participants for protocol 2 (P2). The first line (A) represents the ratio of efficacy for the two groups (Grey dots for NC and Black dots for MCI). Then the next lines (B–E) show the evolution of the index from ratio of efficacy (index 0) to DAS.,P2 score (index 4) including omission (B), repetition (C), bad achievement of activities (D), and planning errors (E). Measurements represented for each participant j: (A) REff = Index0,P2 (j) (Percentage of time spent in the room to behave directed to perform a listed activities). (B)
(impact of omission mistakes on the REff). (C)
(cumulative impact of omission and repetition (excluding repetition of leisure activities) mistakes on the REff). (D)
(cumulative impact of omission, repetition (excluding repetition of leisure activities) mistakes and bad achievement of activities on the REff). (E) Final DAS score
(cumulative impact of omission, repetition (excluding repetition of leisure activities) mistakes, bad achievements of activities, and planification mistakes on the REff).
![Figure 3 DAS.,P2 scores for MCI patients and NC participants for protocol 2 (P2). The first line (A) represents the ratio of efficacy for the two groups (Grey dots for NC and Black dots for MCI). Then the next lines (B–E) show the evolution of the index from ratio of efficacy (index 0) to DAS.,P2 score (index 4) including omission (B), repetition (C), bad achievement of activities (D), and planning errors (E). Measurements represented for each participant j: (A) REff = Index0,P2 (j) (Percentage of time spent in the room to behave directed to perform a listed activities). (B) Index1,P2(j)=[REff(j)]×k1,P2α1,F2 (j) (impact of omission mistakes on the REff). (C) Index2,P2(j)=[REff(j)]×∏i=12k1,P2a1,F2 (j) (cumulative impact of omission and repetition (excluding repetition of leisure activities) mistakes on the REff). (D) Index3,P2(j)=[REff(j)]×∏i=13k1,P2a1,F2 (j) (cumulative impact of omission, repetition (excluding repetition of leisure activities) mistakes and bad achievement of activities on the REff). (E) Final DAS score Sj,P2 (k1,P2, k2,P2, k3,P2, k4,P2,) (j)=[REff(j)]×∏i=14k1,P2a1,F2 (j) (cumulative impact of omission, repetition (excluding repetition of leisure activities) mistakes, bad achievements of activities, and planification mistakes on the REff).](/cms/asset/fce0e6bb-dbaa-4641-9adf-c67de1345a96/dcia_a_36297_f0003_b.jpg)
Figure 4 Performance evaluation of the assessment methodology to classify observation data as MCI group or NC group. (A) Specificity and sensitivity in function of the cutoff point of DAS.,P2() scores. (B) Receiver operating curve associated with the protocol 2.
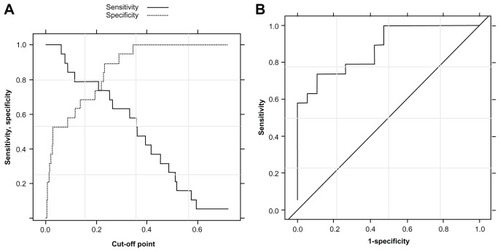
Table 7 Ratio of efficacy and qualitative parameters in the two protocols for each diagnosis group