Figures & data
Figure 1 Distribution of the 24-hour recall NEAP by 526 healthy elderly (50–80 years) (A) and 135 young (23–28 years) (B) men.
Notes: The mean (SD) estimated NEAP was 44.1 (15.2) mEq/d and 40.8 (11.15) mEq/d for the elderly and the young, respectively. The median, 25th percentile, 75th percentile, as well as minimum and maximum NEAP were 43.9, 38.9, 48.7, 8.0, and 71.9 for the elderly, respectively; and 40.8, 34.1, 45.9, 9.7, and 73.9 mEq/d for the young, respectively.
Abbreviations: NEAP, net endogenous acid production; SD, standard deviation.
Abbreviations: NEAP, net endogenous acid production; SD, standard deviation.
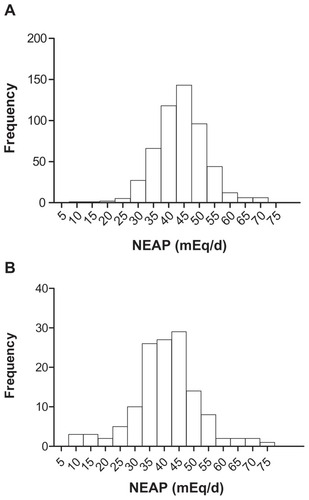
Table 1 Anthropometrics, nutrient intake, and dietary acid loads of the elderly and young
Figure 2 Correlation between NEAP and age and selected anthropometrics. NEAP versus age (A), body mass index (BMI) (B), WC (C), and %BF (D).
Abbreviation: BF, body fat; NEAP, net endogenous acid production; WC, waist circumference.
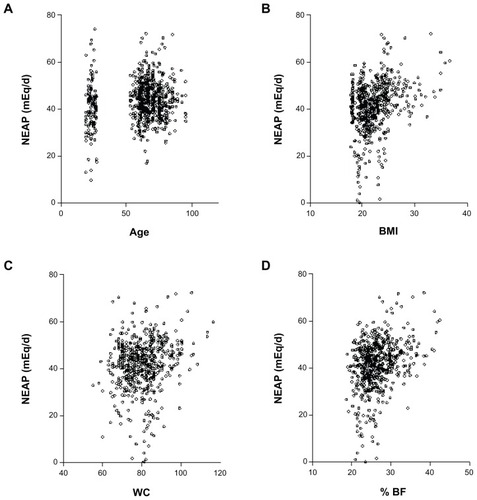
Figure 3 Correlation between NEAP and selected nutrients. NEAP versus energy (A), protein (B), calcium (Ca) (C), potassium (K) (D), magnesium (Mg) (E), and phosphorus (P) (F).
Abbreviation: NEAP, net endogenous acid production.
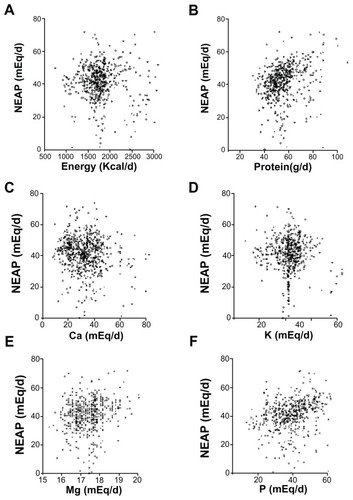
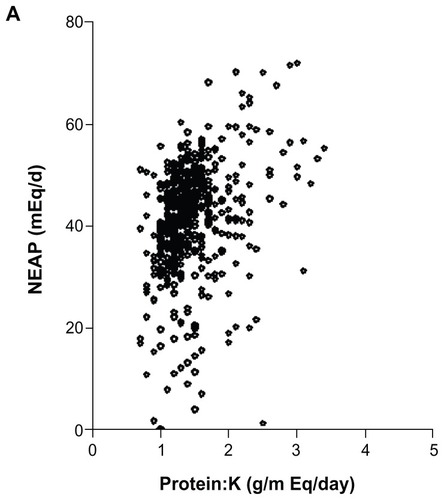
Figure 4 Comparison of estimates of acid–base balance using NEAPCitation13 and protein:potassium (K) ratio.Citation16
Abbreviation: NEAP, net endogenous acid production.