Figures & data
Figure 1 Set of polystyrene balls used for the assessment of joint position sense.
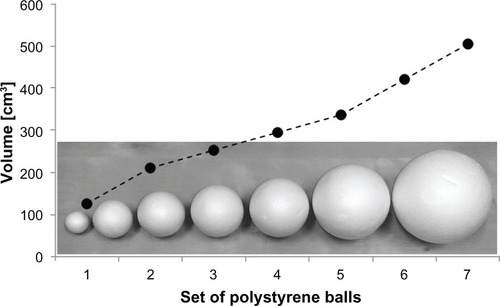
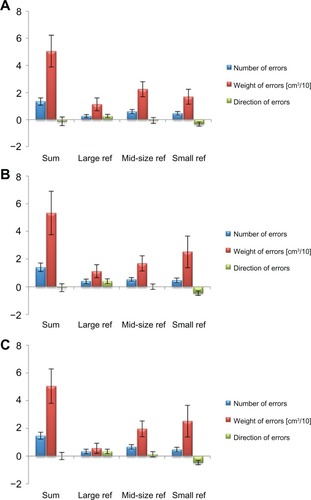
Figure 2 Joint position sense performance in the three subtests (large reference, mid-size reference, and small reference). The performance was assessed in young subjects (A), adult subjects (B), and older adults (C).
Abbreviation: ANOVA, analysis of variance.
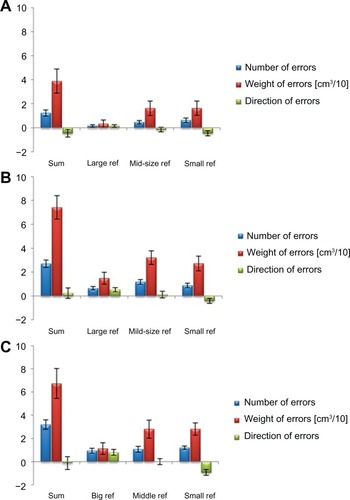
Figure 3 Joint position sense performance across the lifespan. There was a significant age-related change across all variables acquired by the joint position sense test. The number of errors increased with age (N = 45; r = 0.543, P ≤ 0.001) (A) Similarly, the weight of errors increased with age (N = 45; r = 0.311, P = 0.038) (B). There was no significant difference in the average direction of errors between the subjects of the three age groups (N = 45; r = 0.072, P = 0.637), but the scatter of these data increased with age (N = 9 (ie, standard deviation obtained in the three subtests per age group); r = 0.543, P ≤ 0.001) (C).
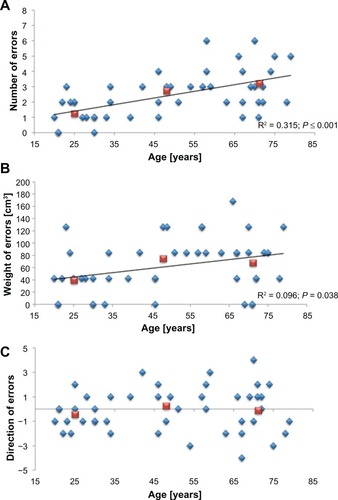
Figure 4 Correlation-analyses of joint position sense parameters. We calculated significant correlations between the number of errors and both other parameters of the proprioceptive hand function test (weight of errors; partial correlation corrected for age; N = 45; r = 0.737; P ≤ 0.001 (A), and absolute value of direction of errors; partial correlation corrected for age; N = 45; r = 0.418; P = 0.005 (B)).
Notes: The analyses were based on the summed values of the three subtests. Blue diamonds give individual data; red squares give mean ± SD.
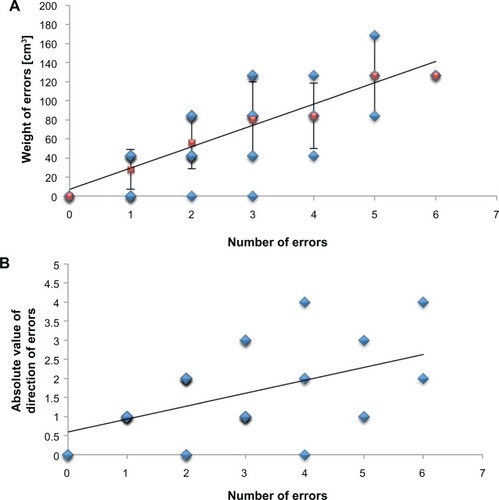
Figure 5 Test–retest reliability of the joint position sense assessment. The test–retest reliability was investigated in a subset of 15 mid-aged subjects, who performed the joint position sense test on 3 consecutive days (day one (A); day two (B); day three (C)) within 1 week.