Figures & data
Figure 1 Representative MHC single muscle fiber silver-stained SDS–PAGE from a heart failure patient.
Notes: Lanes 1 and 7 represent a hybrid isoform that coexpresses both MHC IIx and MHC IIa; lanes 2, 4, and 8 represent MHC IIa; and lanes 3, 5, and 6 represent MHC I isoforms.
Abbreviations: MHC, myosin heavy chain; SDS–PAGE, sodium dodecyl sulfate– polyacrylamide gel electrophoresis.
Abbreviations: MHC, myosin heavy chain; SDS–PAGE, sodium dodecyl sulfate– polyacrylamide gel electrophoresis.
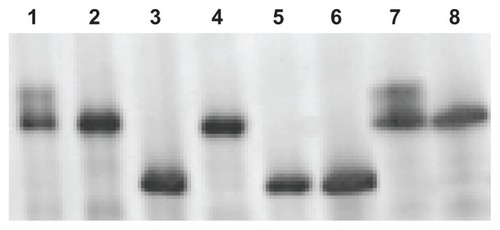
Table 1 Average of total fiber count out on approximately 200 fibers per subject that were analyzed for the MHC isoform distribution
Figure 2 Whole-muscle CSA and insulin-like growth factor-1 mRNA expression in heart failure patients.
Notes: Pearson product-moment correlation coefficient was used to describe the linear relationship. This relationship was highly correlated at r = 0.931 (P < 0.05).
Abbreviations: IGF-1, insulin-like growth factor-1; CSA, cross-sectional area.
Abbreviations: IGF-1, insulin-like growth factor-1; CSA, cross-sectional area.
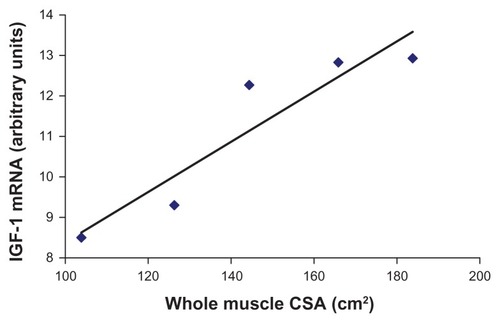
Figure 3 The melt-curve analysis for IGF-1 and β-actin.
Note: The curve to the left represents IGF-I and the curve to the right represents the β-actin.
Abbreviation: IGF-1, insulin-like growth factor-1.
Abbreviation: IGF-1, insulin-like growth factor-1.
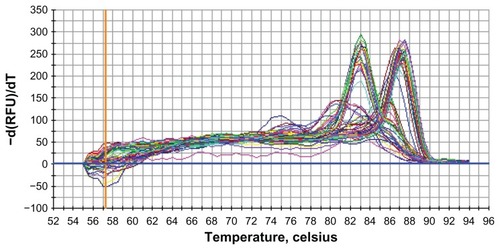
Table 2 Average whole-muscle strength measurements for both isometric and isokinetic maximal voluntary contractile (MVC) strength of the right knee extensors for both the heart failure and control groups