Figures & data
Table 1 Clinical characteristics of study subjects by gender
Table 2 Correlation coefficients between age and clinical parameters in males
Table 3 Correlation coefficients between age and clinical parameters in females
Table 4 Body shape biological age prediction model in males (R2 = 0.705)
Table 5 Body shape biological age prediction model in females (R2 = 0.763)
Figure 1 The body shape BA prediction model in males.
Notes: The 45° line represents the theoretical normal aging line in males. The experimental line is the predicted regression line on body shape BA, and both dotted lines mean the range of ± 1 standard deviation (67%). The equation: body shape BA: −16.958 + 281.419 (WHR) − 1.595 (HC) − 0.149 (Ht) − 0.112 (LBM%) − 0.052 (Wt).
Abbreviations: BA, biological age; WHR, waist-to-hip ratio; HC, hip circumference; Ht, height; LBM%, lean body mass percentage; Wt, weight.
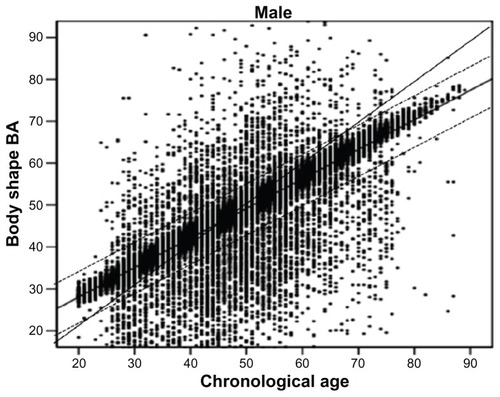
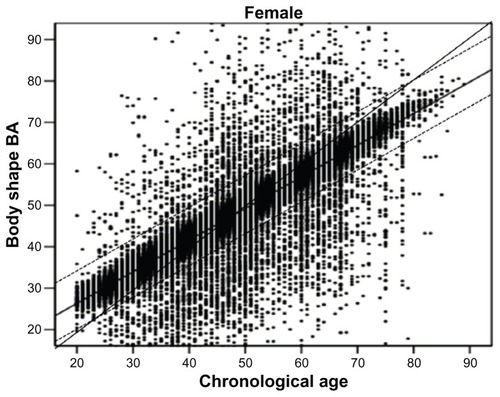
Figure 2 The body shape and BA prediction model in females.
Abbreviations: BA, biological age; WHR, waist-to-hip ratio; Ht, height; HC, hip circumference; LBM%, lean body mass percentage; WC, waist circumference.