Figures & data
Table 1 Descriptive and comparative statistics: sarcopenic versus nonsarcopenic individuals
Figure 1 Mean impedance vectors and confidence ellipses from groups with and without sarcopenia.
Abbreviations: D, Mahalanobis distance; H, height; R, resistance; Xc, reactance.
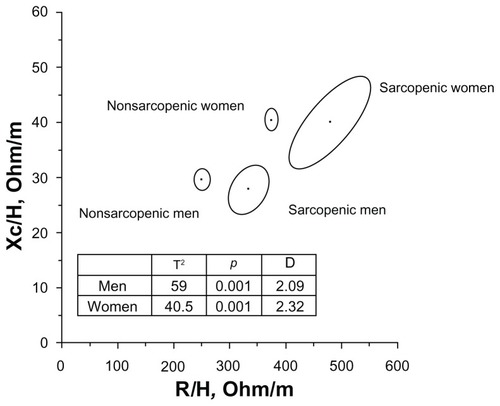
Table 2 Descriptive and comparative statistics: sarcopenic versus sarcopenic obese men
Figure 2 Mean impedance vectors and confidence ellipses from sarcopenic men with FM% higher or lower than the median value of the sex-specific whole sample. (A) Classic BIVA; (B) specific BIVA.
Abbreviations: D, Mahalanobis distance; FM, fat mass; H, height; R, resistance; sp, specific; Xc, reactance.
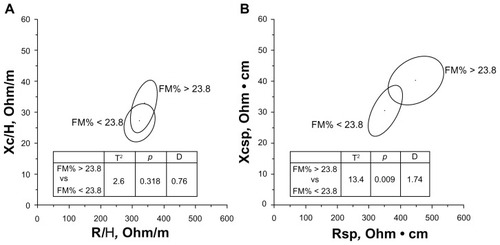
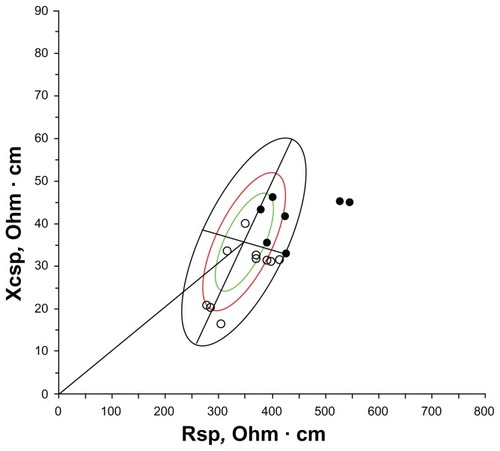
Figure 3 The individual specific vectors of sarcopenic men plotted on the sex-specific bivariate tolerance ellipse.
Notes: White dots indicate sarcopenic nonobese men; black dots indicate sarcopenic obese men.
Abbreviations: R, resistance; sp, specific; Xc, reactance.
Abbreviations: R, resistance; sp, specific; Xc, reactance.