Figures & data
Figure 1A Illustration of the experimental condition in the “Walking Stroop carpet”.
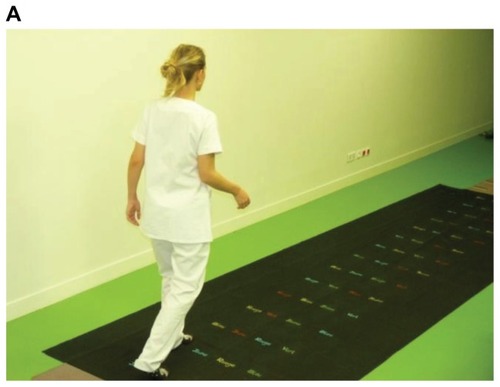
Figure 1B First condition: DTB&W.
Note: In that condition, the subject has to read and to walk on the word “yellow”.
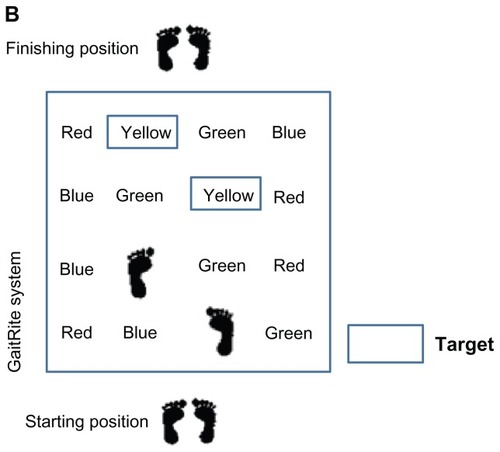
Figure 1C Second condition: DTWord.
Note: In that condition, the subject has to read and to walk on the word “yellow”.
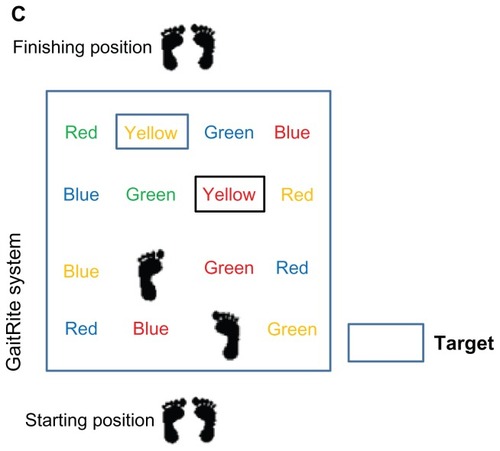
Figure 1D Third condition: DTColor.
Note: In that condition, the subject has to read and to walk on the color “green”.
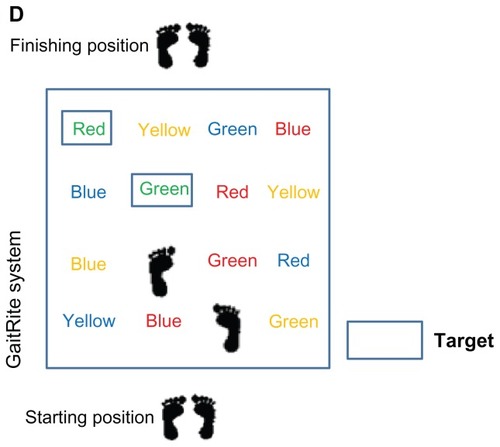
Figure 2 Gait pattern Dendogram of the ST.
Notes: The cluster analysis consists in pairing the individuals based on the similarities of their overall gait parameters and in progressively grouping subjects until we have one group that gathers all the participants.
Abbreviations: Y, Young; O, Older; VO, Very Older; H, Healthy; BL, Borderline MCI; naMCI, non-amnesic MCI executive impairment only; aMCI, amnesic MCI; mdMCI, multiple-domain amnestic MCI.
Abbreviations: Y, Young; O, Older; VO, Very Older; H, Healthy; BL, Borderline MCI; naMCI, non-amnesic MCI executive impairment only; aMCI, amnesic MCI; mdMCI, multiple-domain amnestic MCI.
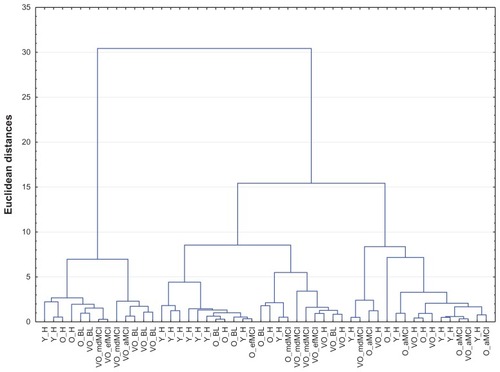
Figure 3 Gait pattern Dendogram of the ST and WSC.
Notes: The figure is read from the bottom where the individual trials are listed, in two families, to top where all gait trials are grouped into a single family. The cluster analysis consists in pairing individuals based on the similarities of their overall gait parameters in dual-task condition (WSC), and in progressively grouping subjects until we have one group that gathers all the participants. The classification through this ascendant hierarchical method highlights a tree structure with two distinct branches brought together within a value of Euclidian distance smaller than 20 for a final merging higher than 50.
Abbreviations: Y, Young; O, Older; VO, Very Older; H, Healthy; BL, Borderline MCI; naMCI, non-amnesic MCI executive impairment only; aMCI, amnesic MCI; mdMCI, multiple-domain amnestic MCI.
Abbreviations: Y, Young; O, Older; VO, Very Older; H, Healthy; BL, Borderline MCI; naMCI, non-amnesic MCI executive impairment only; aMCI, amnesic MCI; mdMCI, multiple-domain amnestic MCI.
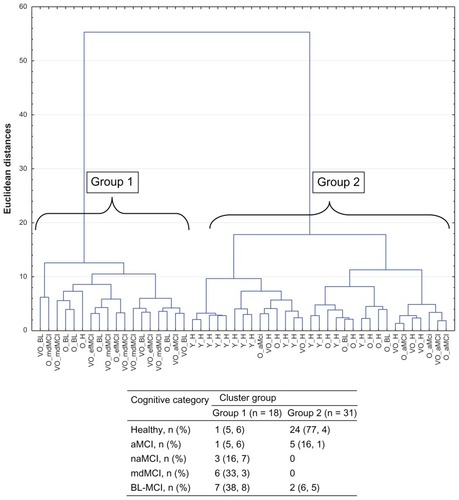
Table 1 Number of errors in all conditions in DT
Figure 4 Results of analysis of variance (ANOVA) on gait parameters in each cluster group and walking test condition.
Note: *Significant difference for P-value < 0.05.
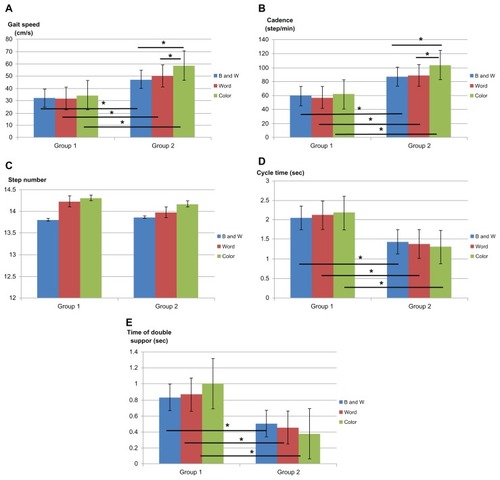
Table 2 Demographic and clinical characteristics of study participants stratified by cluster results