Figures & data
Figure 1 CONSORT (Consolidated of Standards of Reporting Trials) flow diagram.
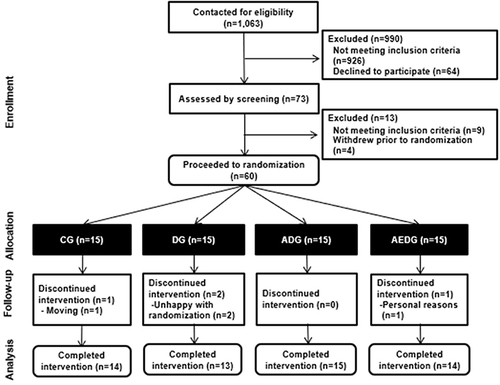
Figure 2 Study design.
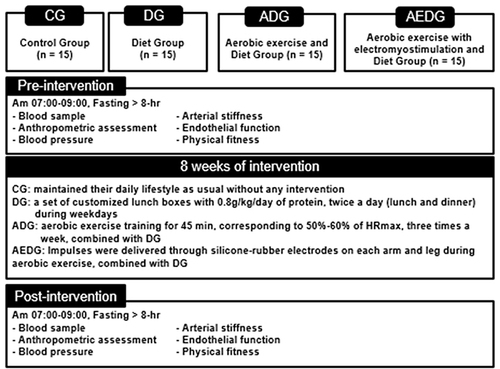
Table 1 Selected Participant Characteristics
Table 2 Changes in Frailty Status Before and After the 8-Week Intervention Period
Table 3 Changes in Macro-Nutrition Components Before and After the 8-Week Intervention Period
Table 4 Changes in Physical Fitness Before and After the 8-Week Intervention Period
Table 5 Changes in Blood Pressure Before and After the 8-Week Intervention Period
Table 6 Changes in Biomarkers Before and After the 8-Week Intervention Period
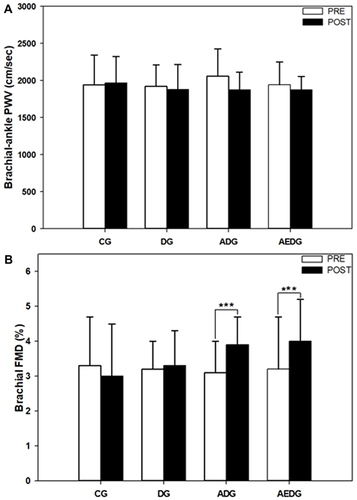
Figure 3 Change in arterial stiffness as assessed by (A) brachial-ankle pulse wave velocity (baPWV) and (B) endothelium-dependent vasodilation as assessed by brachial flow-mediated dilation (FMD) before and after the 8-week intervention period. Data are expressed as means ± SD. *** p < 0.001 vs before intervention.