Figures & data
Table 1 Demographic and clinical characteristics of study participants
Table 2 Correlation coefficients for potential correlates and change in TUG
Figure 1 Scatter graph showing the relationship between change in Timed Up and Go test and Mini-Mental State Examination scores.
Abbreviations: MMSE, Mini-Mental State Examination; TUG, Timed Up and Go test.
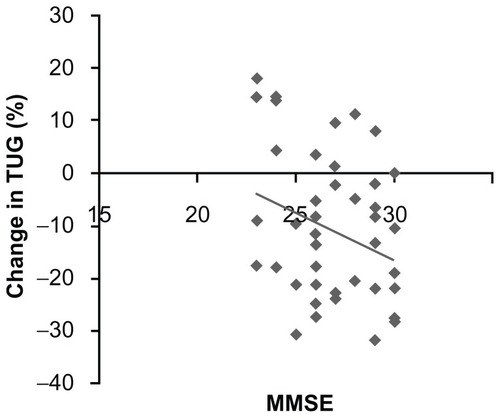
Table 3 Factors associated with improved TUG in stepwise multiple regression