
Figures & data
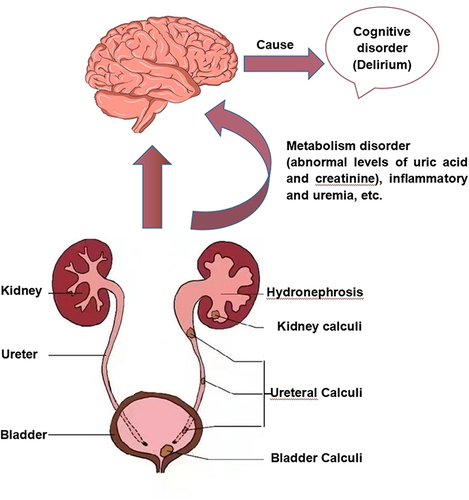
Figure 1 Flow chart of study population.
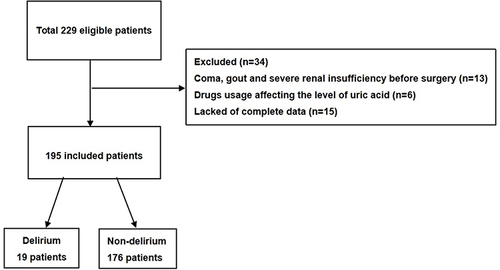
Figure 2 The distribution characteristics of postoperative delirium.
Notes: (A) Time of the onset of postoperative delirium. (B) The incidence of postoperative delirium in various surgical procedures.
Abbreviations: URSL, Ureteroscopic Lithotripsy; PCNL, Percutaneous Nephrolithotomy; THLC, Transurethral Holmium Laser Cystolithotripsy.
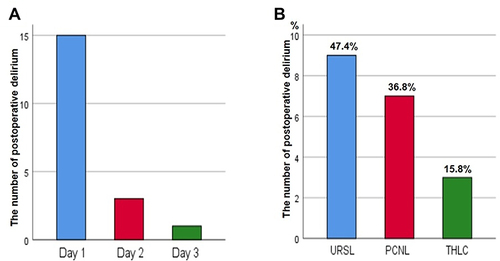
Table 1 Characteristics of Patients with and without Delirium
Table 2 Analyses of Risk Factors for Postoperative Delirium
Figure 3 The predictive value of the risk stratification score.
Notes: (A) The predictive risk of delirium according to the risk score (score 0–3). The POD incidence was 2% in score 0, 10.5% in score 1, 22.7% in score 2, and 42.9% in score 3 (P<0.001). (B) The predictive accuracy of risk stratification score by the ROC curve indicated that the AUC was 0.802 (P<0.001, 95% CI=0.698–0.907).
Abbreviations: AUC, Area Under Curve; POD, Postoperative Delirium; ROC, Receiver Operator Characteristic.
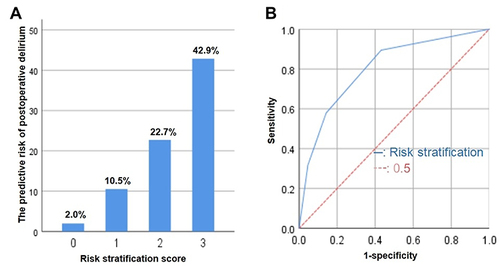
Table 3 Comparison of Clinical Outcomes in Both Groups