Figures & data
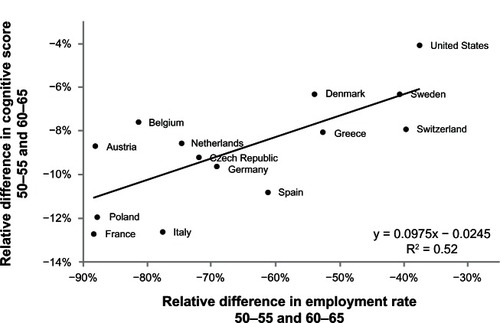
Figure 1 The distance concept.
Abbreviations: SFA, stochastic frontier analysis; OLS, ordinary least squares.
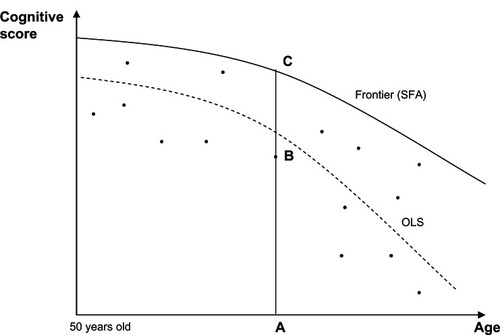
Table 1 Cognitive performance by country, age group and education (Mean scores)
Table 2 Stochastic frontier model of cognitive performance
Figure 2 Stochastic frontier: cognitive global assessment as a function of age and years of education.
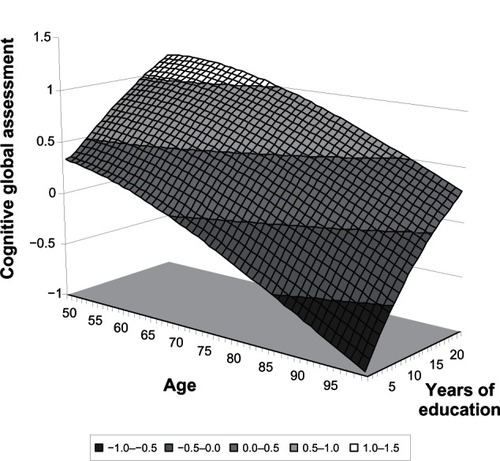
Table 3 Impact of z variables on cognitive performance (equivalent years of cognitive aging for 60-year-old individuals)
Figure 3 Employment rate and memory score.
Reproduced from Bonsang E, Adam S, Perelman S. Does retirement affect cognitive functioning? Netspar discussion paper 11/2010-069;2010.Citation46
Notes: Relative difference between men aged 60–65 years and 50–55 years. Survey of health, Ageing and Retirement in Europe 2004–2006. Health Retirement Study 2004 for the US. The relative difference in employment rate/cognitive score is defined as
(Y60–65–Y50–55)/Y50–55 for Yi = the average employment rate/cognitive score for the age category i.