Figures & data
Figure 1 Flow diagram for the inclusion and exclusion criteria.
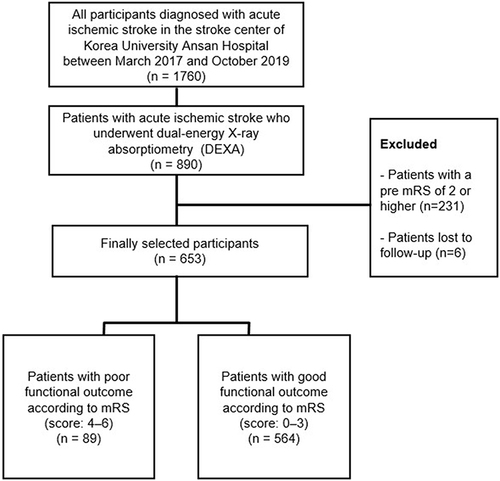
Figure 2 A representative dual-energy X-ray absorptiometry image used for skeletal muscle mass measurement.
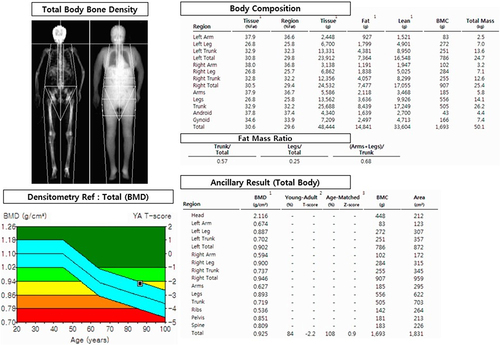
Table 1 Baseline Characteristics of Study Participants
Table 2 Body Scales, Laboratory Findings, and Medications of Study Participants
Figure 3 (A and B) Modified Rankin Scale scores at 90 days according to the diagnosis of sarcopenia. The distribution of scores on the modified Rankin Scale is shown. Scores ranged from 0 to 6, with 0 indicating no symptoms, 1 indicating no clinically significant disability, 2 indicating slight disability (patient is able to handle own affairs without assistance but unable to carry out all previous activities), 3 indicating moderate disability (patient requires some help but is able to walk unassisted), 4 indicating moderately severe disability (patient is unable to attend to bodily needs without assistance and is unable to walk unassisted), 5 indicating severe disability (patient requires constant nursing care and attention), and 6 indicating death. (C) Modified Rankin Scale scores at 90 days according to the quartiles of height-adjusted ASM. Categorical variables were divided into four groups (Q1–4) based on the quartiles of height-adjusted ASM. Q1 implied the highest value of height-adjusted ASM and Q4 implied the lowest value.
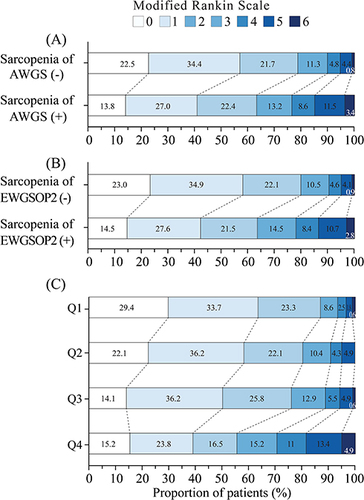
Table 3 Univariable and Multivariable Analyses for Poor Functional Outcome
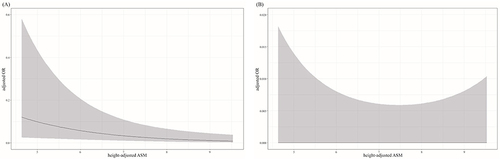
Figure 4 Restricted cubic spline models for the relationship between clinical outcome (poor function and mortality) and height-adjusted ASM. (A) Poor functional outcome in relation to height adjusted ASM (P = 0.008). (B) Mortality in relation to height-adjusted ASM (P = 0.860). The adjusted ORs are represented by solid lines and the 95% confidence intervals of the adjusted ORs are represented by shaded areas. The restricted cubic spline model was adjusted for age; sex; body mass index; white blood cell count; hemoglobin levels; high-sensitivity C-reactive protein level; TG; estimated glomerular filtration rate; homocysteine level; National Institute of Health Stroke Scale score; DM; AF; use of statins, antiplatelet agents, and anticoagulants; the Trial of ORG 10172 in Acute Stroke Treatment classification; symptomatic ICH; in-hospital infection; and time from admission to the dual-energy X-ray absorptiometry scan.