Figures & data
Figure 1 Atorvastatin improved the spatial learning and memory of rats impaired by Aβ1-42, using the Morris water maze test. (A) Escape latency onto a hidden platform; (B) probe test; and (C) working memory.
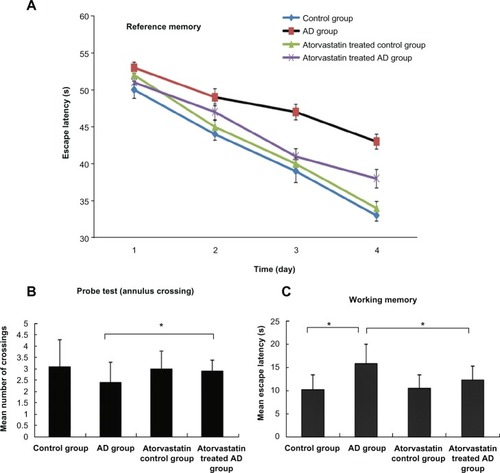
Figure 2 Pathological changes in the hippocampus of rats in each group on day 7 after Aβ injection (original magnification × 400). (A) Control group; (B) atorvastatin control group; (C) AD group; and (D) atorvastatin-treated AD group.
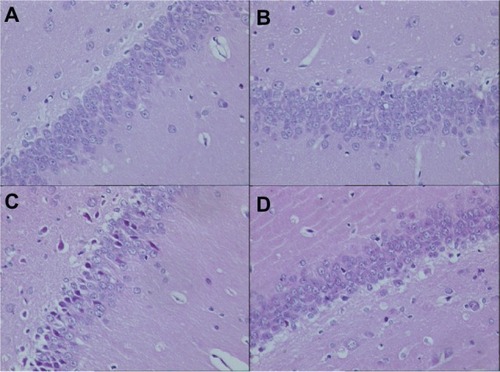
Figure 3 Atorvastatin attenuated IL-1β expression in the hippocampus of Aβ1-42-treatedrats. The upper panel shows IL-1 β-positive cells in the rat hippocampus, detected by immunohistochemistry on day 7 after Aβ injection (original magnification x 400). (A) Control group (Group 1); (B) atorvastatin control group (Group 2); (C) AD group (Group 3); and (D) atorvastatin-treated AD group (Group 4). (E) The lower panel shows the counted number of IL-1 β-positive cells in rat hippocampus.
Notes: Data are the mean ± SD of each individuals. *P < 0.01.
Abbreviations: Aβ, amyloid-beta (peptide); IL, interleukin; AD, Alzheimer’s disease.
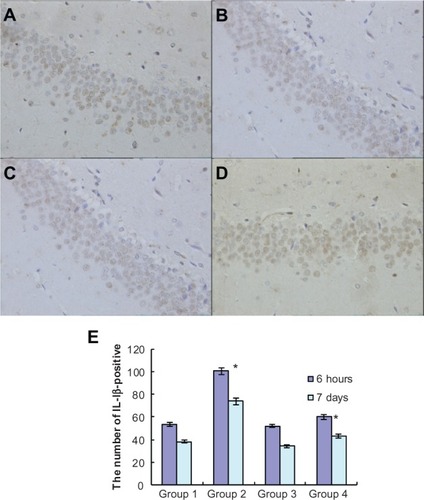
Figure 4 Atorvastatin attenuated IL-6 expression in the hippocampus of Aβ1-42-treated rats. The upper panel shows IL-6-positive cells in the rat hippocampus, detected by immunohistochemistry on day 7 after Aβ injection (original magnification x 400). (A) Control group (Group 1); (B) atorvastatin control group (Group 2); (C) AD group (Group 3); and (D) atorvastatin-treated AD group (Group 4). (E) The lower panel shows the counted number of IL-6-positive cells in rat hippocampus.
Notes: Data are the mean ± SD of each individuals. *P < 0.01.
Abbreviations: IL, interleukin; Aβ, amyloid-beta (peptide); AD, Alzheimer’s disease.
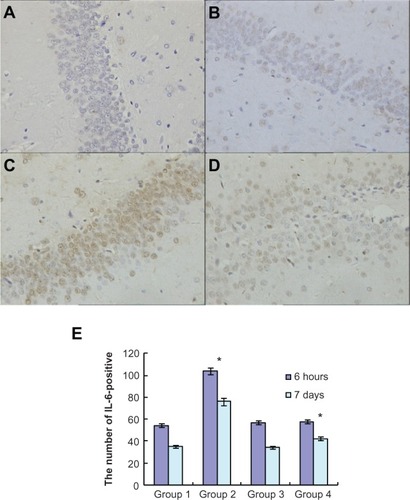
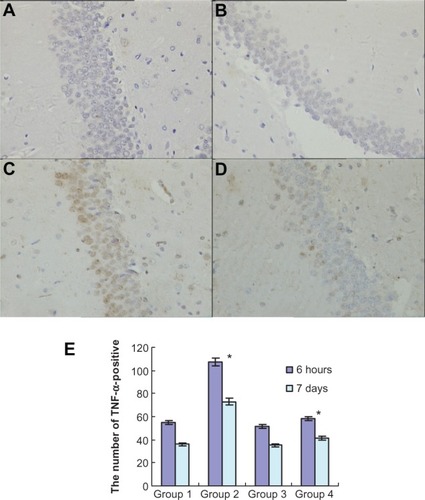
Figure 5 Atorvastatin attenuated TNF-α expression in the hippocampus of Aβ1-42-treated rats. The upper panel shows TNF-α-positive cells in the rat hippocampus, detected by immunohistochemistry on day 7 after Aβ injection (original magnification × 400). (A) Control group (Group 1); (B) atorvastatin control group (Group 2); (C) AD group (Group 3); and (D) atorvastatin-treated AD group (Group 4). (E) The lower panel shows the counted number of TNF-α-positive cells in rat hippocampus.
Abbreviations: TNF-α, tumor necrosis factor alpha; Aβ, amyloid-beta (peptide); AD, Alzheimer’s disease.