
Figures & data
Table 1 Outline of Default Participant Activities (for the Intervention Group)
Table 2 Outcome Variables Measured for All Study Participants
Figure 1 Overview of the Independence study with CONSORT Flow Diagram.
Notes: Adapted from Eldridge SM, Chan CL, Campbell MJ, et al. CONSORT 2010 statement: extension to randomised pilot and feasibility trials. BMJ. 2016;355. Copyright: © 2016 Eldridge et al. Creative Commons Attribution License.Citation15.
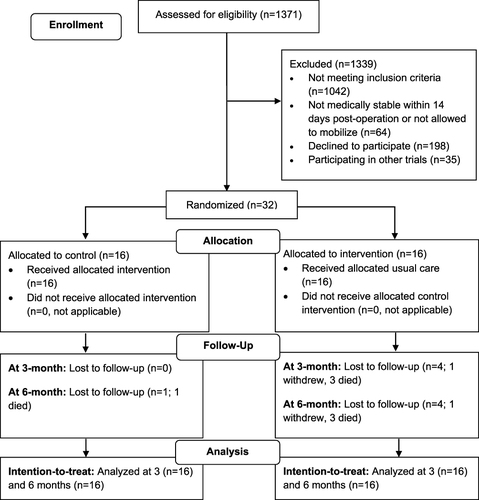
Table 3 Baseline Characteristics of Study Participants (n=32)
Table 4 Baseline and Effects of Intervention on Outcome Variables, Intention-to-Treat Analyses
Table 5 Effects of Intervention on Clinical Outcomes, Intention-to-Treat Analyses