Figures & data
Figure 1 Flow chart of research sample selection.
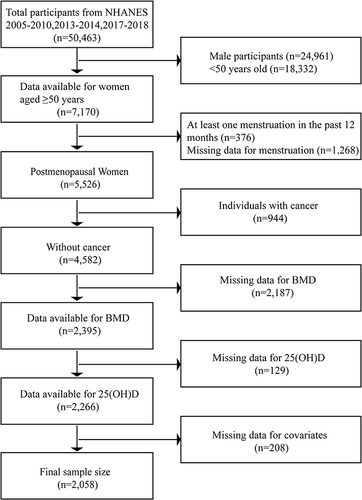
Table 1 Weighted Characteristics of the Study Participants Based on Serum 25-Hydroxyvitamin D [25(OH)D] Concentrations
Table 2 Associations Between Serum 25(OH)D and Osteoporosis of Total Femur, Femoral Neck and Lumbar Spine
Figure 2 Forest plot of age-stratified analyses of the associations between serum 25(OH)D and osteoporosis. (Age, race, education level, family PIR, BMI, total calcium, serum phosphorus, smoking behavior, alcohol consumption, moderate activities, survey months, and years since menopause were adjusted).
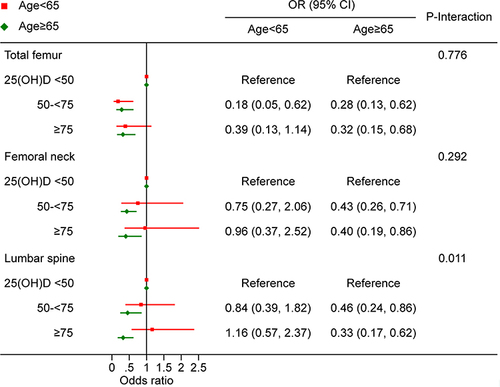
Figure 3 Forest plot of BMI stratified analyses of the associations between serum 25(OH)D and osteoporosis. (Age, race, education level, family PIR, BMI, total calcium, serum phosphorus, smoking behavior, alcohol consumption, moderate activities, survey months, and years since menopause were adjusted).
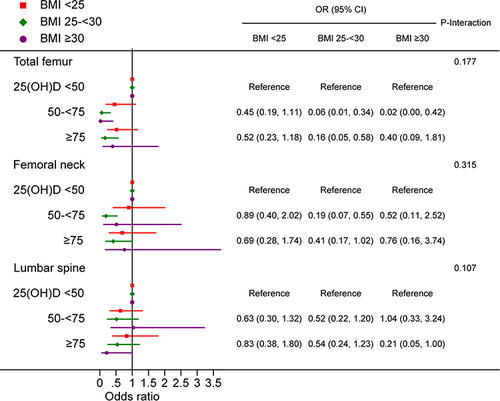
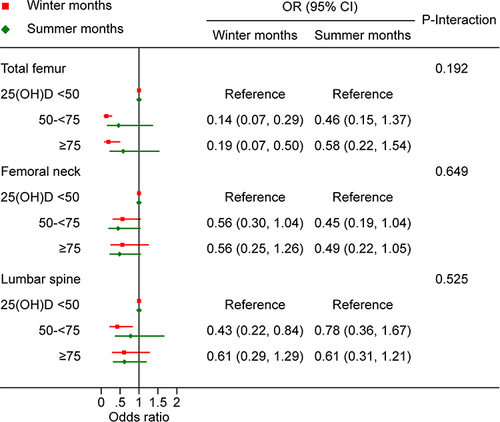
Figure 4 Forest plot of survey months stratified analyses of the associations between serum 25(OH)D and osteoporosis. (Age, race, education level, family PIR, BMI, total calcium, serum phosphorus, smoking behavior, alcohol consumption, moderate activities, and years since menopause were adjusted).