
Figures & data
Figure 1 The process of sample recruitment.
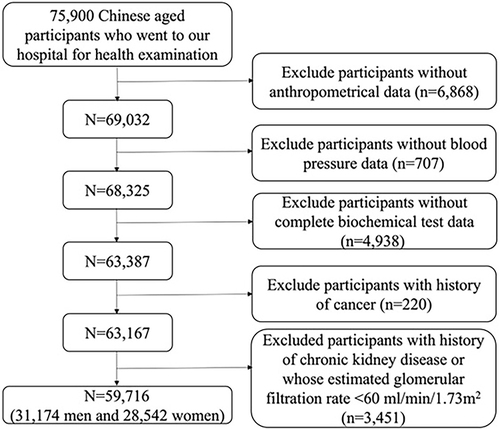
Table 1 Clinical Characteristics in 59,716 Chinese Aged Population
Figure 2 (A) The concentration of total cholesterol across different age groups in 59,716 Chinese aged population. (B) The concentration of total triglycerides across different age groups in 59,716 Chinese aged population. Group 1, 60–64 y; Group 2, 65–69 y; Group 3, 70–74 y; Group 4, 75–79 y; Group 5, ≥80y. The differences in serum total cholesterol and total triglycerides were compared with ANOVA test.
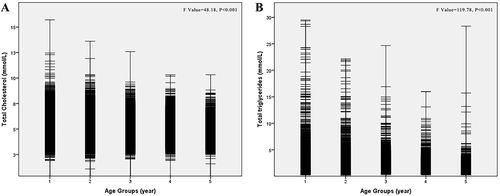
Table 2 The Association Between Age and the Risk of Dyslipidemia in 59,716 Chinese Aged Population: Multivariate Logistic Regression Analysis
Table 3 The Association Between Age and the Risk of Dyslipidemia in Chinese Aged Population by Logistic Regression Model: Sensitivity Analysis