Figures & data
Figure 1 Pre-and postoperative imaging data of a patient in the interlaminar technique group. (A–D) The imaging data shows obvious stenosis of the L4-5 spinal canal. The red box in subfigure B indicates the site of lumbar stenosis. (E) Under endoscopic visualization, the ligamentum flavum is cut open. Asterisk shows the ligamentum flavum. (F and G) The working channel (X) is rotated, and the nerve root (#) is pushed gently away from the channel, then the herniated discs (black arrow) could be exposed for removal. (H) Postoperative cross-sectional CT shows a significant enlargement of the spinal canal.
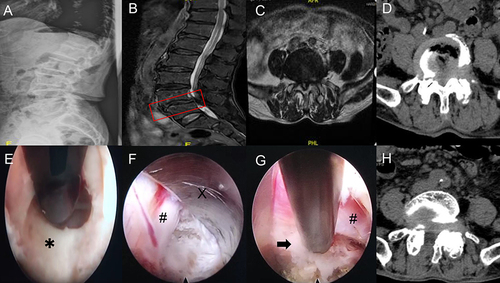
Figure 2 Pre-and postoperative imaging data of a patient in the transforaminal technique group. (A–D) The imaging data shows obvious stenosis of the L4-5 spinal canal. The red box in subfigure B indicates the site of lumbar stenosis. (E) Part of the ventral elements on the superior articular process is removed. Asterisk shows the superior articular process. (F and G) The working channel (X) is well established, after the herniated discs are removed, the ventral side of the nerve root (#) is fully decompressed. A black arrow shows the posterior longitudinal ligament. (H) Postoperative cross-sectional CT shows the spinal canal decompression range is limited.
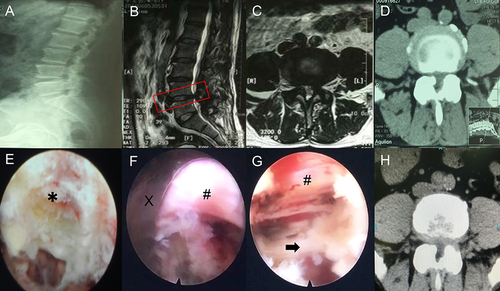
Table 1 Demographics and Comorbidities of Study Patients
Figure 3 The entry point and osteotomy range of interlaminar and transforaminal techniques. (A) The entry point of interlaminar technique was above the corresponding lamina space and 2–3 cm from the midline. (B) The range of translaminar space in interlaminar technique did not exceed the outer edge of the nerve root and the attachment point of ligamentum flavum. The yellow box indicates the extent of facet joint and ligamentum flavum resection in ILT. (C) The entry point of transforaminal technique was 8–12 cm from the midline. (D) The grinding ratio of the superior articular process was limited to less than 25%. The yellow box indicates the range of removal of upper articular process in TFT.
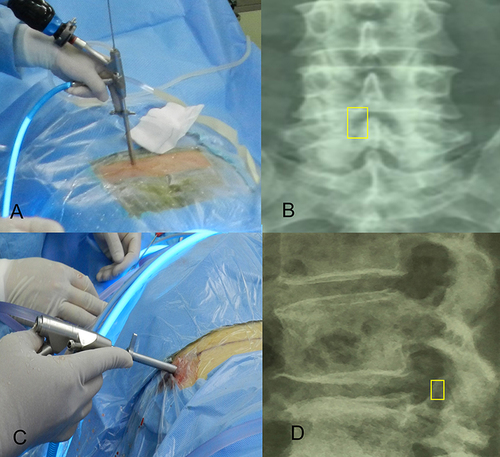
Figure 4 The changes in angulation (A and B) and translation distance (C and D) on the lateral flexion and extension were used to reflect the spine’s stability.
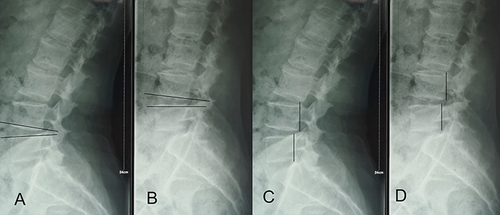
Table 2 VAS of the 2 Groups
Figure 5 Effects of clinical outcomes over time. (A and B) The VAS scores of back and leg pain in different groups. (C and D) The ODI and JOA scores in different groups. *p < 0.05.
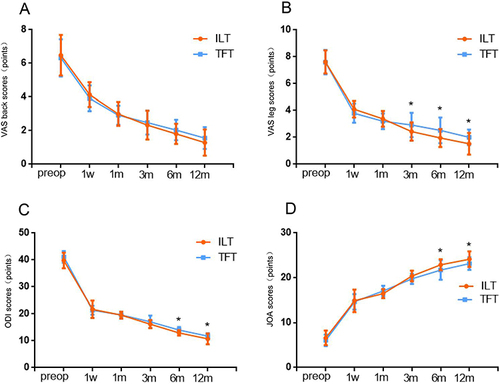
Table 3 ODI and JOA of the 2 Groups
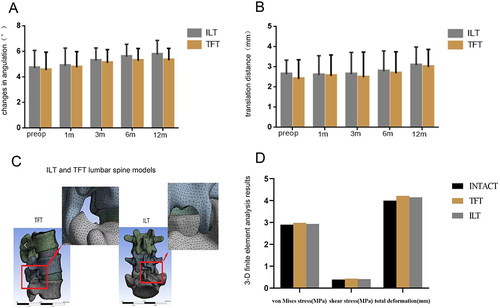
Figure 6 Effects of lumbar stability over time and 3-D finite element analysis. (A) The change in angulation of the spine in different groups. (B) The translation distance of the spine in different groups. (C) Establishment of ILT and TFT lumbar spine models. (D) 3-D finite element analysis results of spine models.