Figures & data
Figure 1 The Ness L300Plus system.
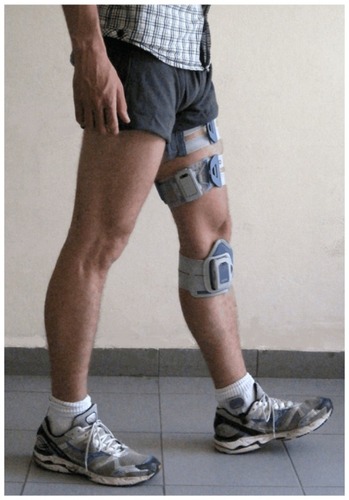
Table 1 Subject characteristics
Table 2 Group means and standard deviations of gait velocity under both conditions at study initiation (T1) and after 6 weeks (T2)
Graph 1 Effect of functional electrical stimulation on gait velocity in the three subgroups of ambulation categories.
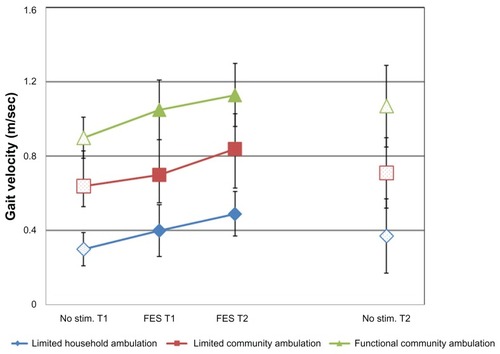
Table 3 Summary of Tukey-Kramer preplanned comparisons